

 I use to sit on the culvert besides the way , and I was so happy to see an youngster drop by me and ask me …. my well wishes and, he share me his time a lot with me. I wonder looking at him some time when he descend from his bike , very rarely , other wise he use to sit on the bike by supporting his leg… I was a poor child in my teen , playing alone on the road in front of my small house. He was young & enthusiastic and I saw him always with laughter and etiquette with ritual marks on his forehead, where as me always in a same trouser… if I couldn’t see him coming.. my mother use to twitter me, da… your kannan in coming .. and I run for him..
.....................................................................A tsunami came and it took me away to the metro and again the second wave drift me to middle east. But he was so burly and based , nothing touched him. God blessed him for his compassion& vigor ever. He became like an oak tree with roots deep aground him, the branches sheltering many birds, there are joy around him…. And me, I find some relief on the other shore, become strong and well but by the time I look back home I find that I am a looser. I literally lost everything I like. My mother is far away from me , am a stranger to my folks now. what I have is some count of bread in my basket..........................
God blessed me too . other wise how could I stand erect alone in the dessert. Now I started ploughing up my land in native to nurture a tree atleast not an oak which can be useful to few lives and children paly around me and the loving clouds showers on me , they will create a dew pond near me and I will shed an acorn into it, to see the ripples calling me feel cool...........................
I am nostalgic as I saw him today
I use to sit on the culvert besides the way , and I was so happy to see an youngster drop by me and ask me …. my well wishes and, he share me his time a lot with me. I wonder looking at him some time when he descend from his bike , very rarely , other wise he use to sit on the bike by supporting his leg… I was a poor child in my teen , playing alone on the road in front of my small house. He was young & enthusiastic and I saw him always with laughter and etiquette with ritual marks on his forehead, where as me always in a same trouser… if I couldn’t see him coming.. my mother use to twitter me, da… your kannan in coming .. and I run for him..
.....................................................................A tsunami came and it took me away to the metro and again the second wave drift me to middle east. But he was so burly and based , nothing touched him. God blessed him for his compassion& vigor ever. He became like an oak tree with roots deep aground him, the branches sheltering many birds, there are joy around him…. And me, I find some relief on the other shore, become strong and well but by the time I look back home I find that I am a looser. I literally lost everything I like. My mother is far away from me , am a stranger to my folks now. what I have is some count of bread in my basket..........................
God blessed me too . other wise how could I stand erect alone in the dessert. Now I started ploughing up my land in native to nurture a tree atleast not an oak which can be useful to few lives and children paly around me and the loving clouds showers on me , they will create a dew pond near me and I will shed an acorn into it, to see the ripples calling me feel cool...........................
I am nostalgic as I saw him today
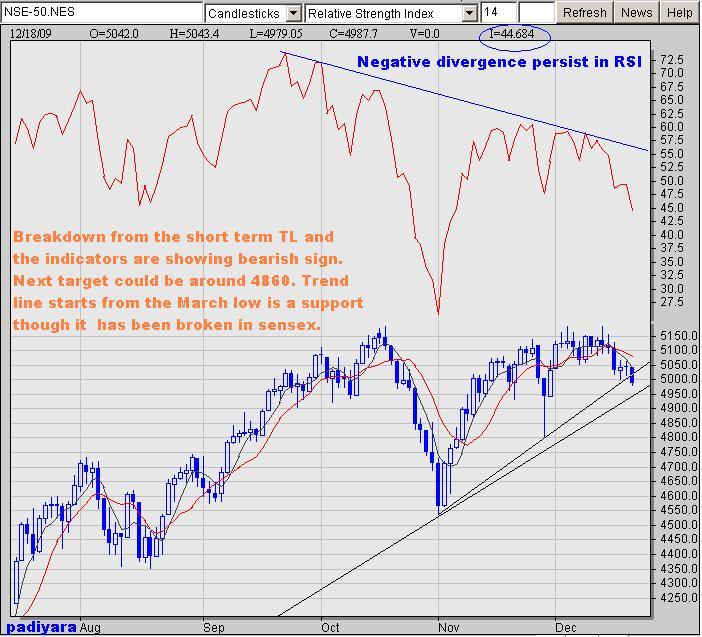
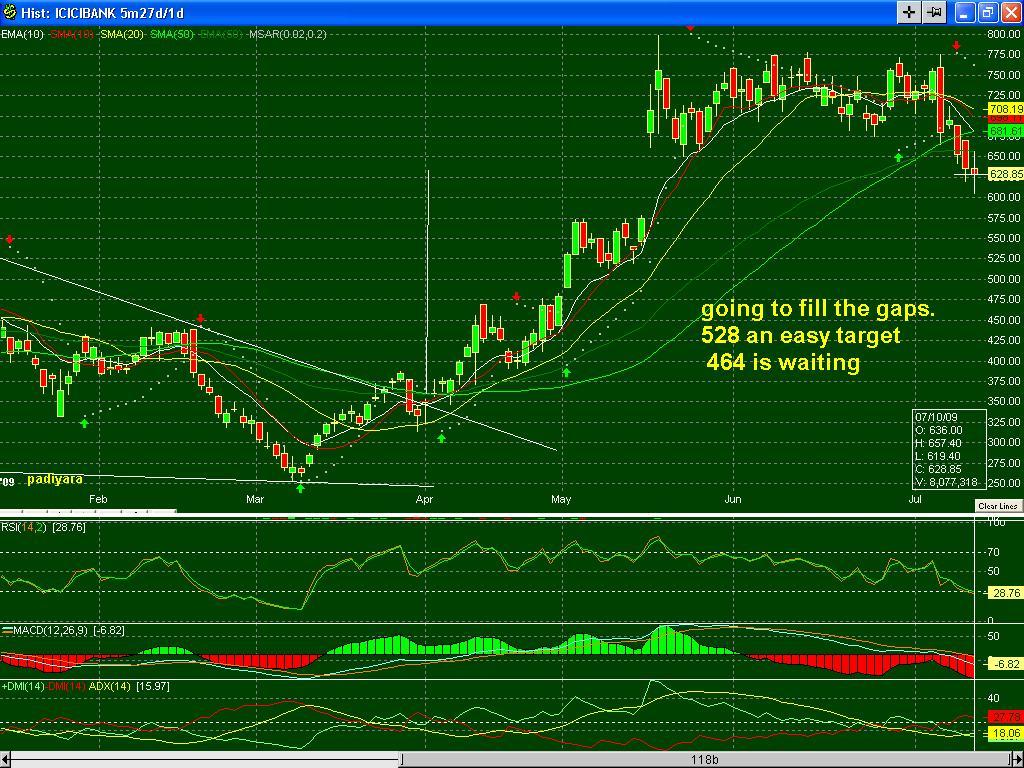
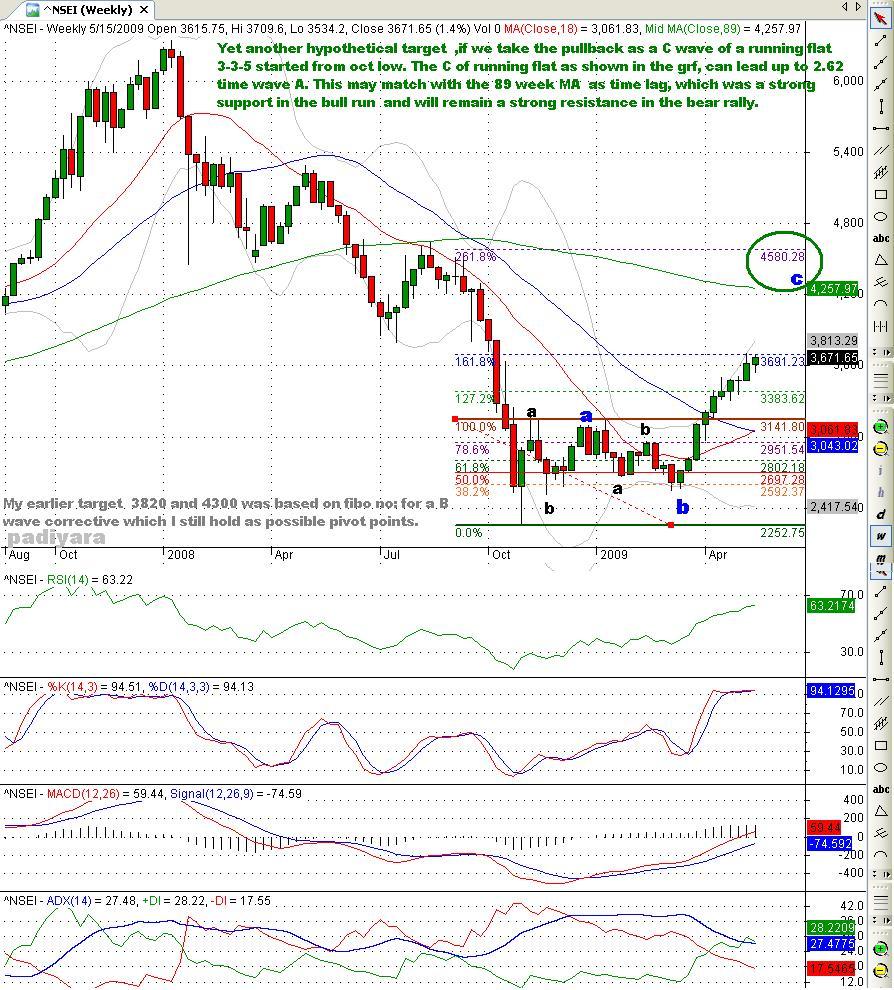
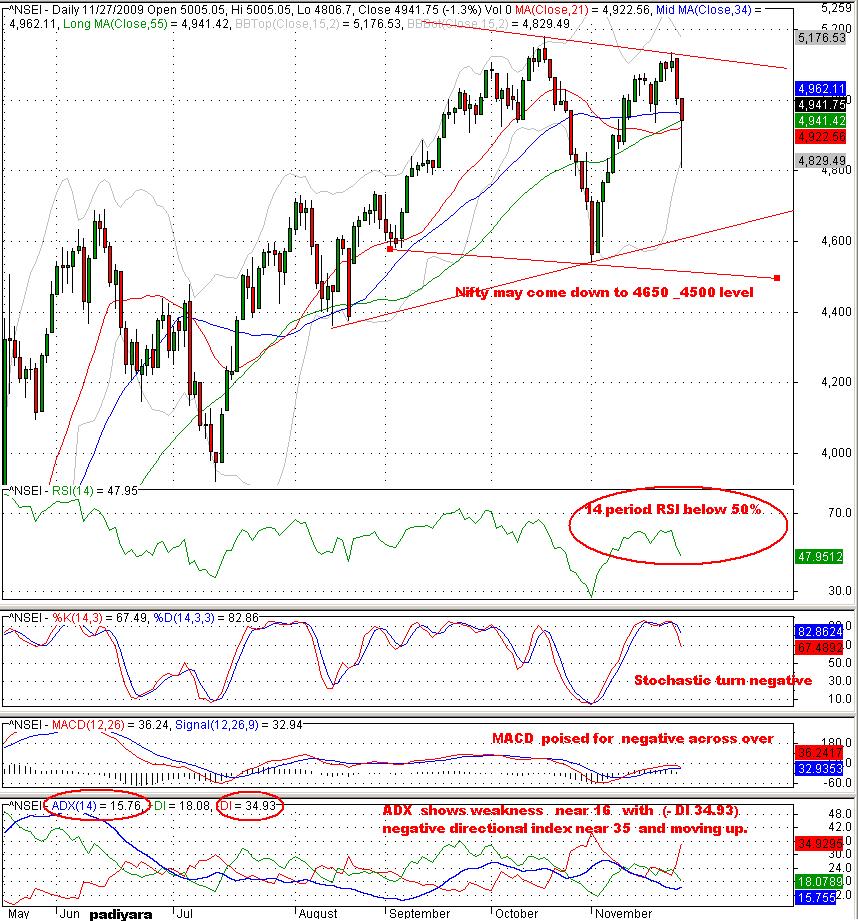
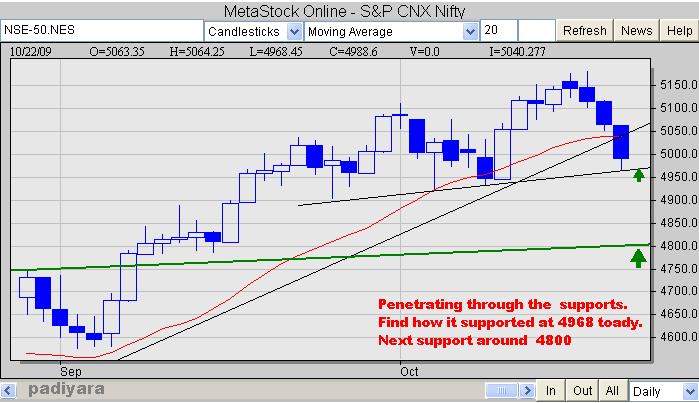
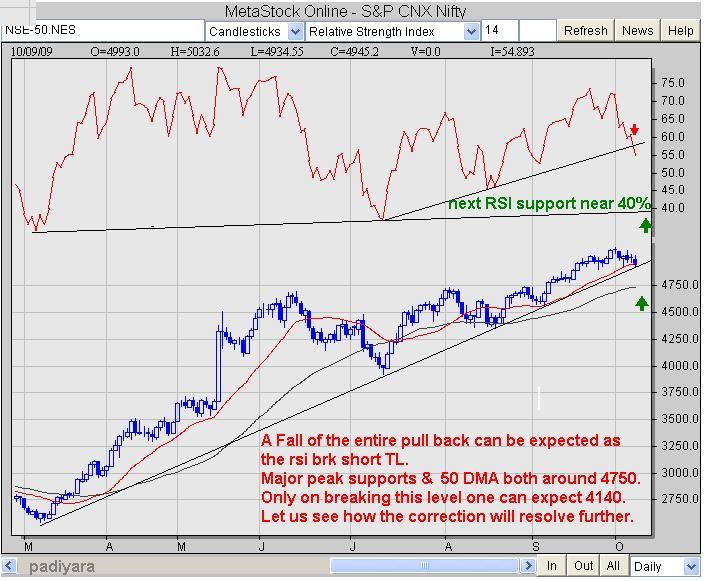
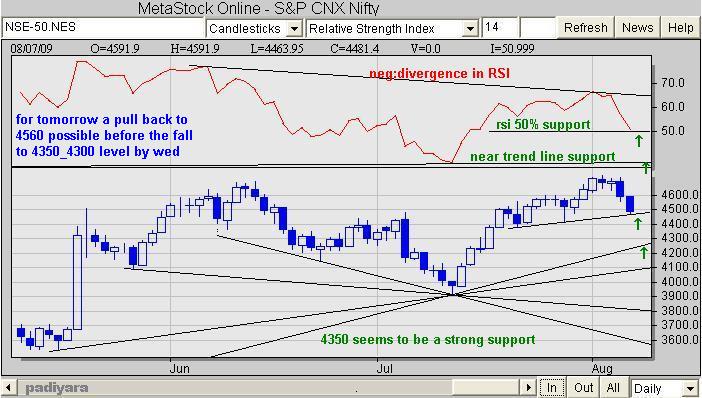
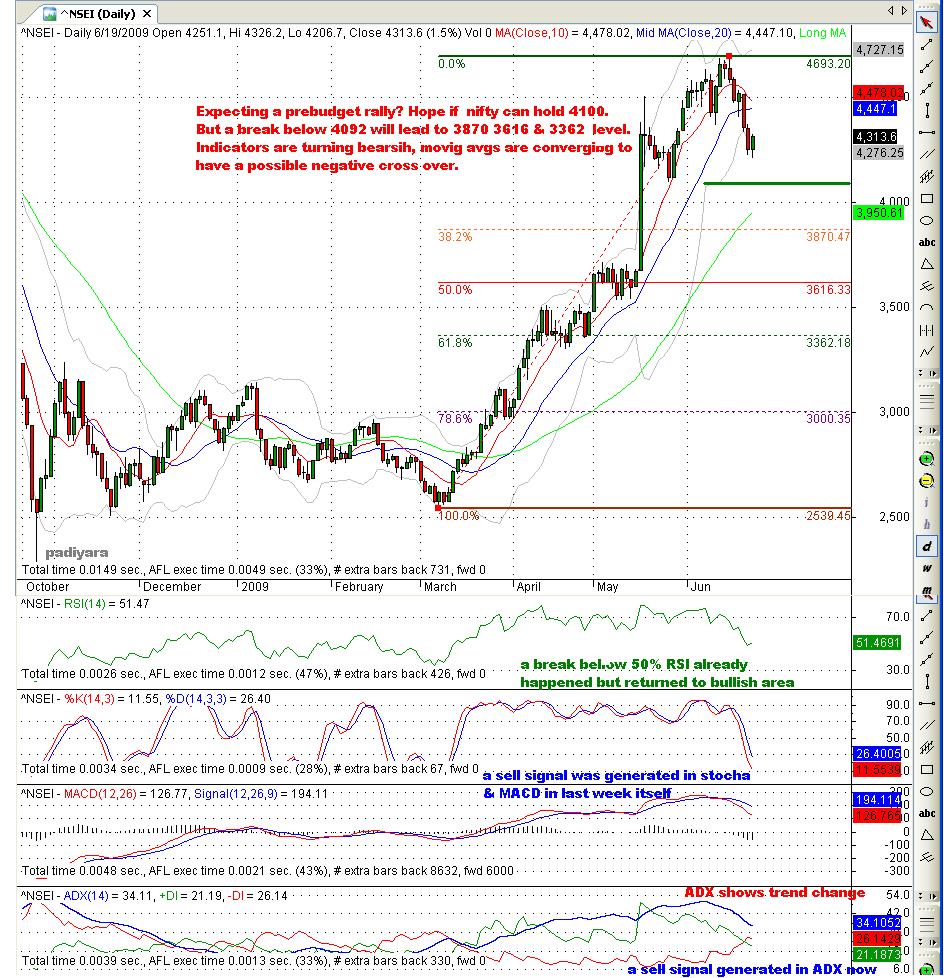
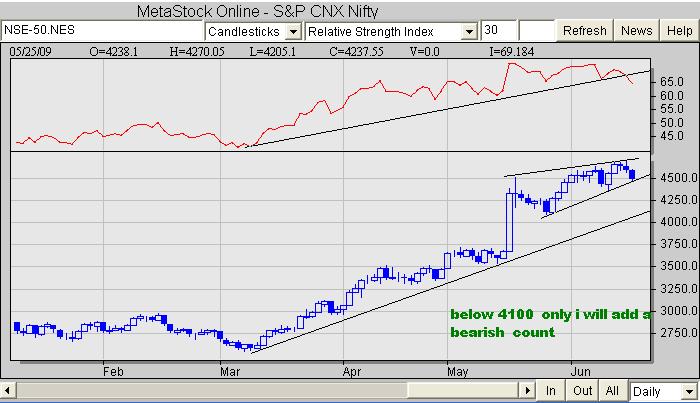
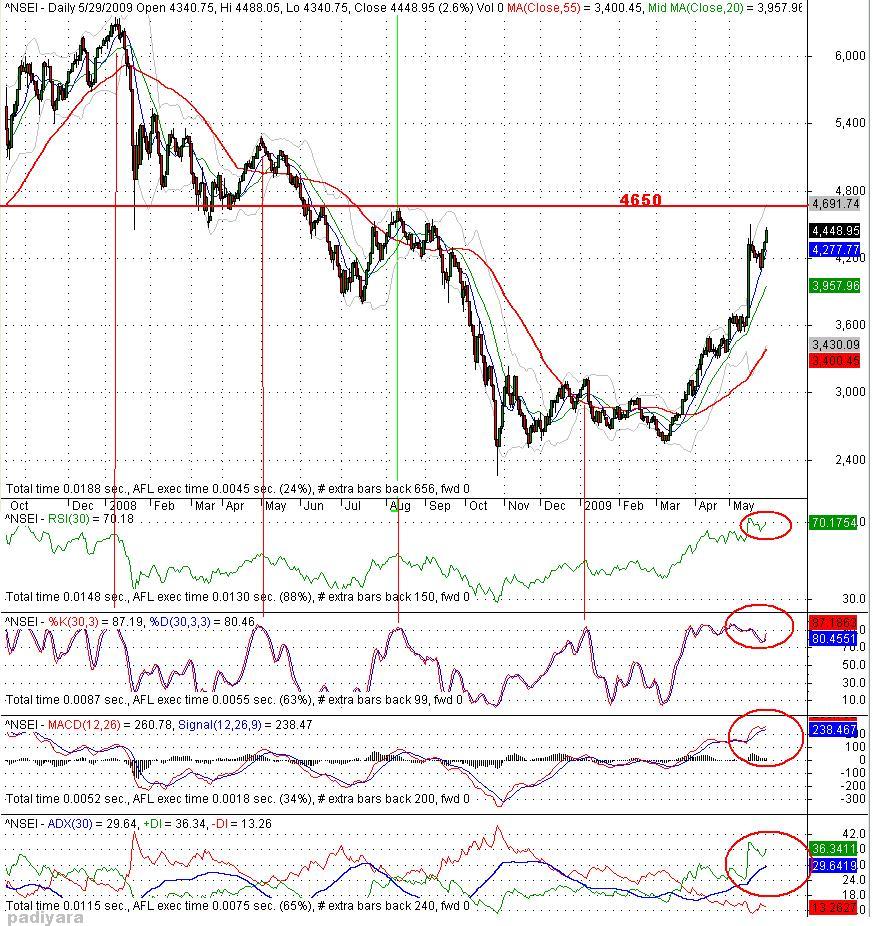
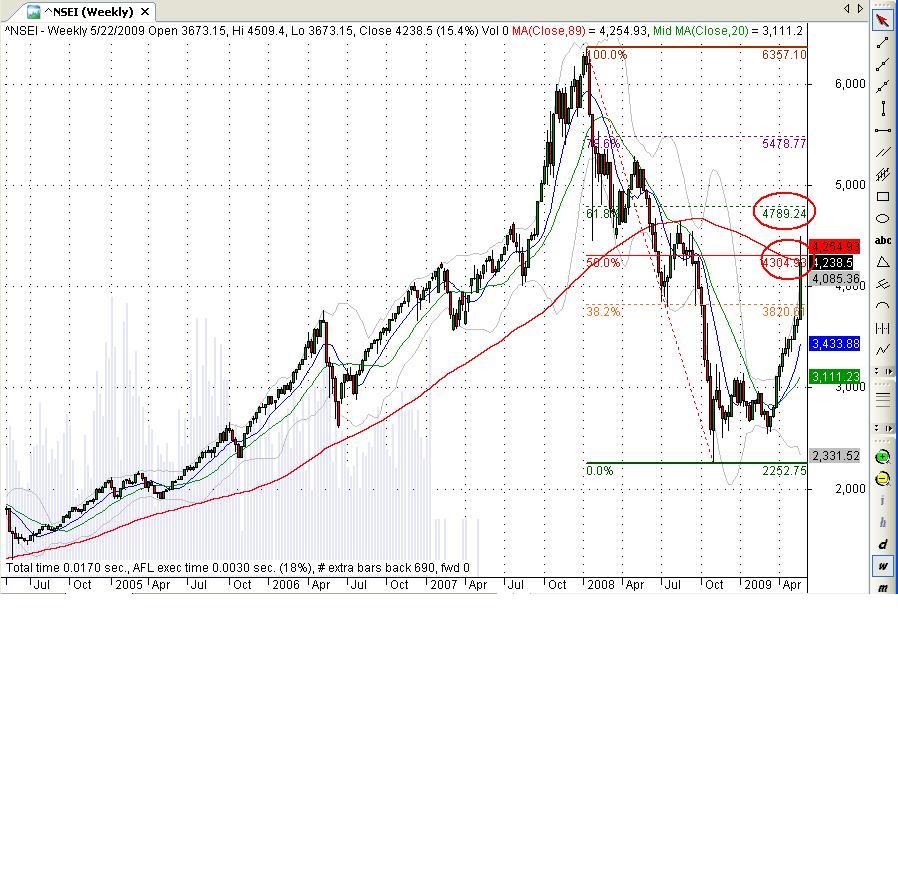
 In my earlier post I was expecting further down side as the channel suppotrs shown in the old charts.
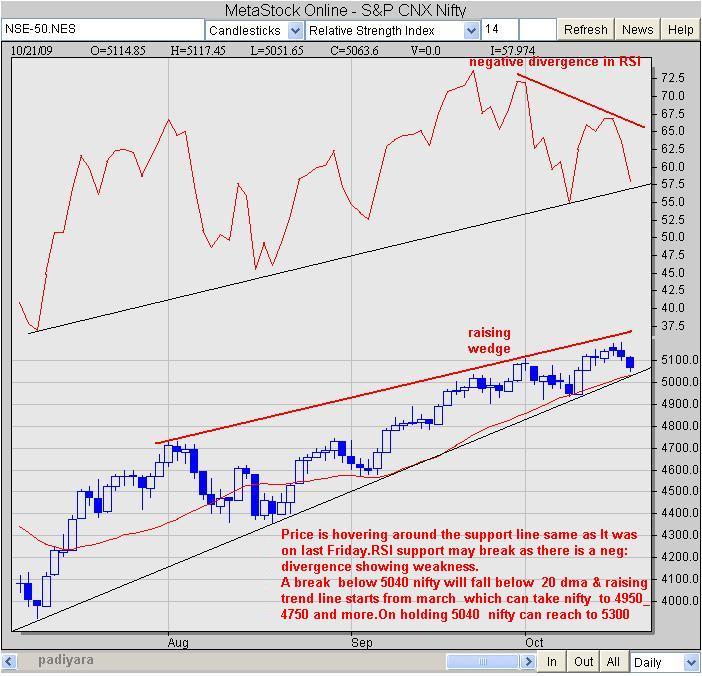
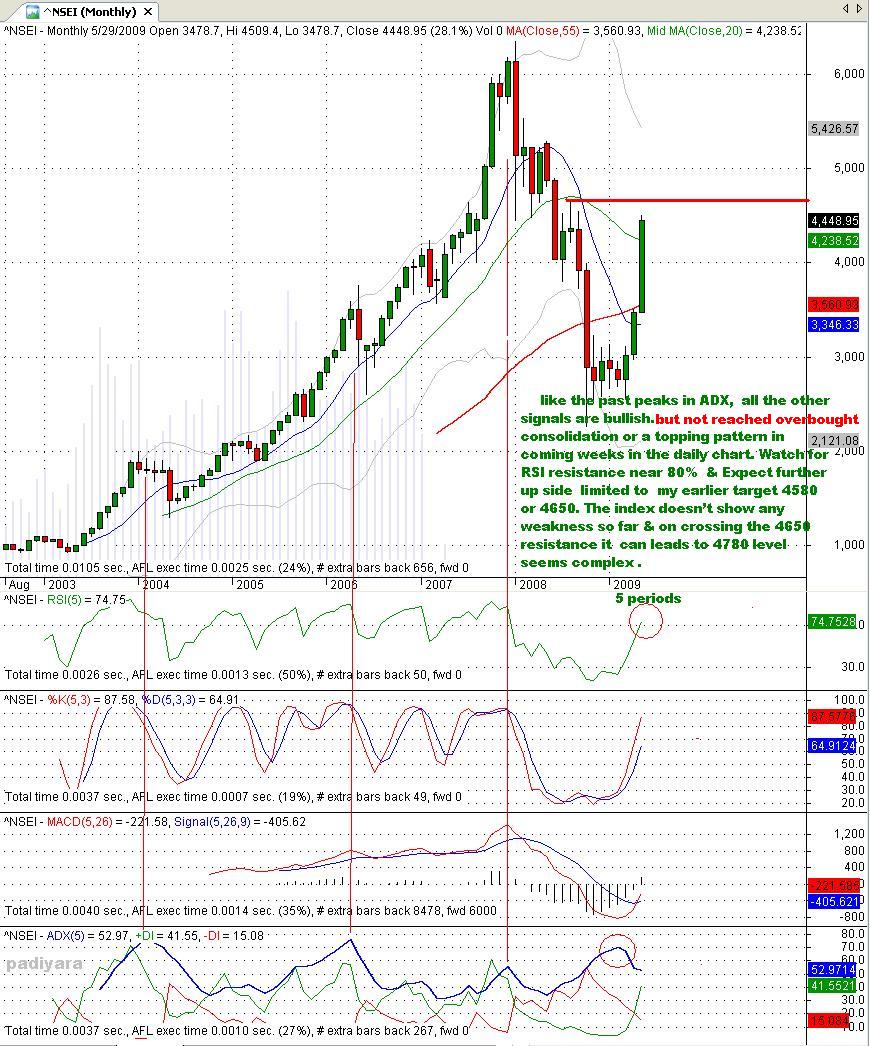
For targets: we may reach 4780(pls refer the monthly chart posted on 31st may)
expect more charts as my schdule changes from next week onwards
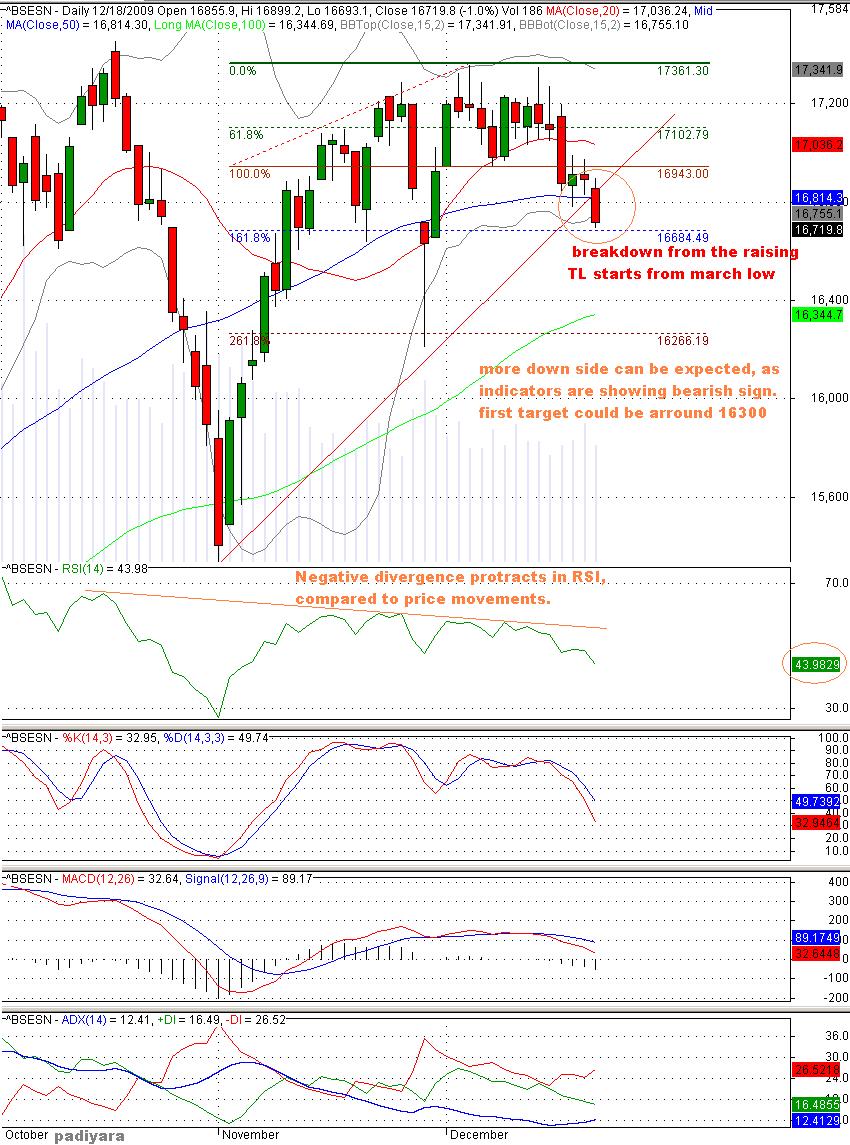
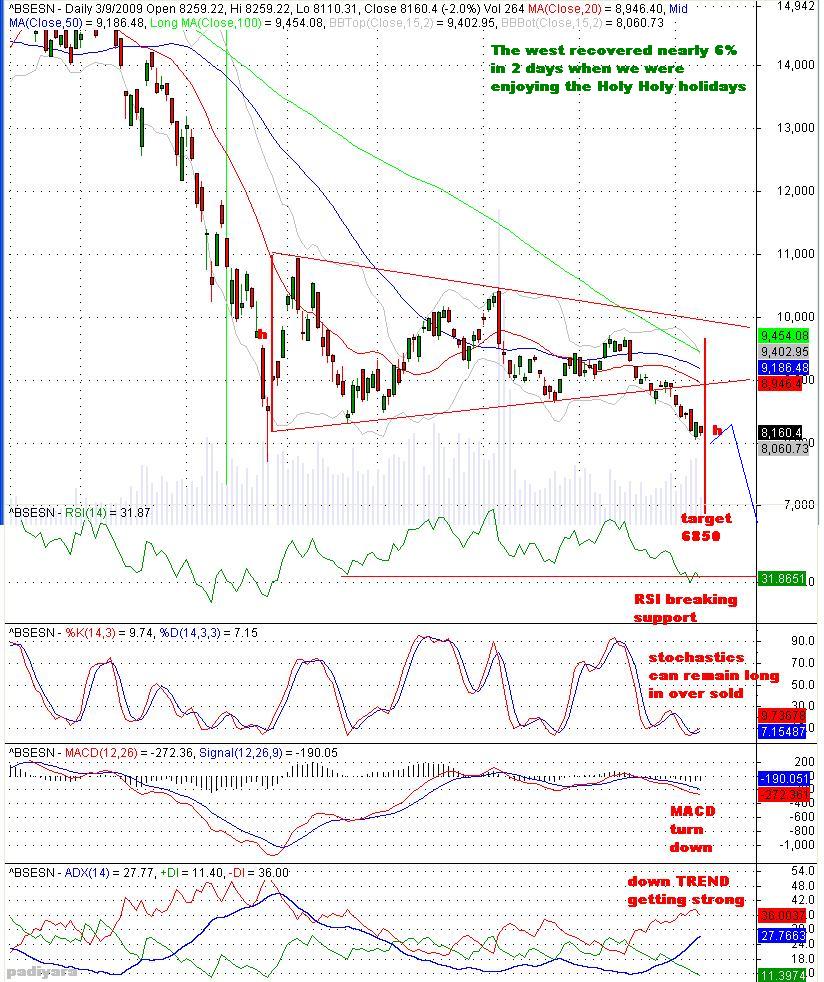
Index majors and some charts with crucial levels shown
In my earlier post I was expecting further down side as the channel suppotrs shown in the old charts.
For targets: we may reach 4780(pls refer the monthly chart posted on 31st may)
expect more charts as my schdule changes from next week onwards
Index majors and some charts with crucial levels shown
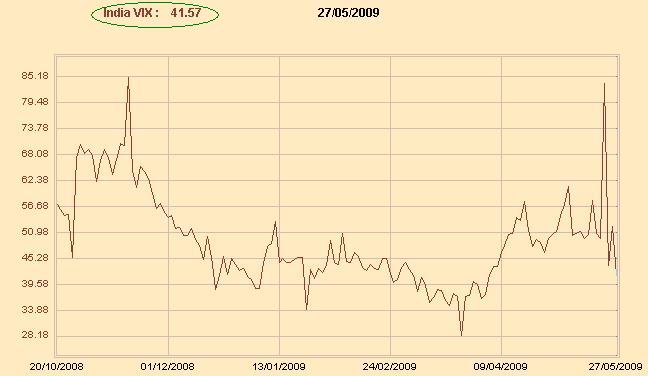
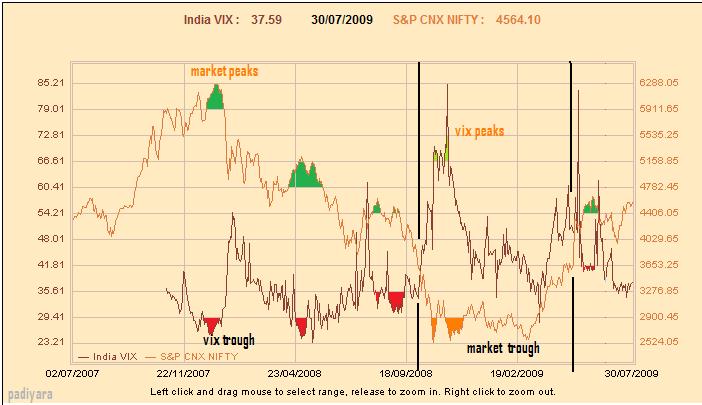
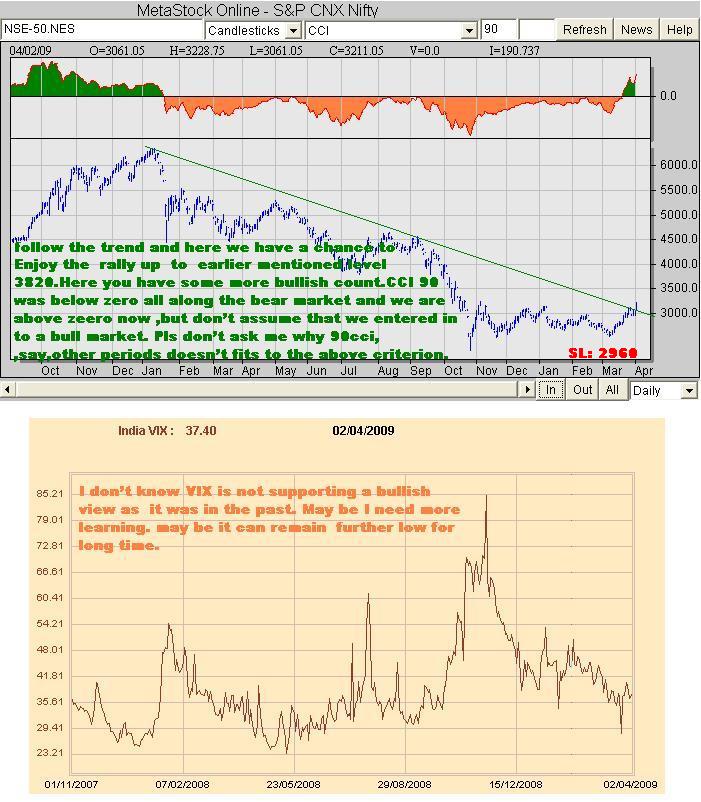
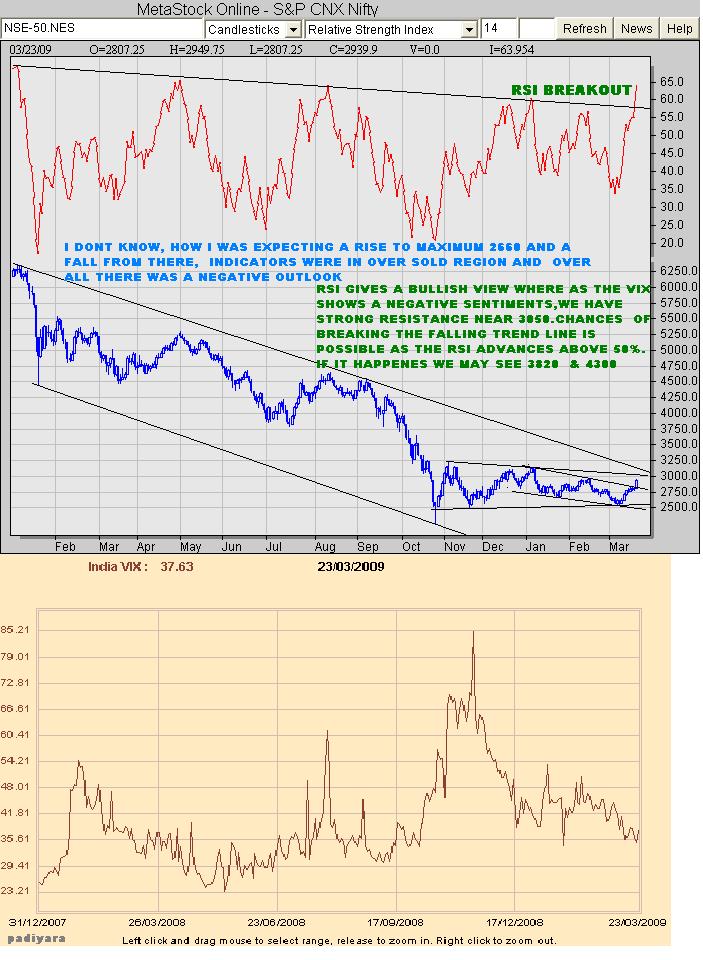
 The value of VIX increases when the market declines and decreases when the market rises,as the rising stock market is viewed as less risky, and a declining stock market more risky.
The higher the perceived risk is in stocks, the higher the implied volatility and the more expensive the associated options, especially puts,Hence, implied volatility is not about the size of the price swings, but rather the implied risk associated with the stock market. When market declines, the demand for puts usually increases & Increased demand means higher put prices & higher implied volatilities.
Comparing VIX action with that of the market can yield good clues on future direction or duration of a move. The further VIX increases in value, the more panic there is in the market. The further VIX decreases in value, the more complacency there is in the market.
Extremely low VIX readings indicate a high degree of complacency, and are generally regarded as BEARISH, readings below 20 as excessively bearish.
Conversely extremely high VIX readings indicate a high degree of panic among options traders, and are regarded at BULLISH.
High VIX readings usually occur after an extended or sharp decline and sentiment is still quite bearish? & readings above 30 as bullish.
Conflicting signals between VIX and the market can also yield sentiment clues for the short term. Overly bullish sentiment or complacency is regarded as bearish On the other hand, overly bearish sentiment or panic is regarded as bullish.
If the market declines sharply and VIX remains unchanged or decreases in value (towards complacency),( like on 25th may ) it could indicate that the decline has further to go.
Contrarians might take the view that there is still not enough bearishness or panic in the market to warrant a bottom. If the market advances sharply and VIX increases in value (towards panic), it could indicate that the advance has further to go. Contrarians might take the view that there is not enough bullishness or complacency to warrant a top.
Courtesy to stock chart.com
The value of VIX increases when the market declines and decreases when the market rises,as the rising stock market is viewed as less risky, and a declining stock market more risky.
The higher the perceived risk is in stocks, the higher the implied volatility and the more expensive the associated options, especially puts,Hence, implied volatility is not about the size of the price swings, but rather the implied risk associated with the stock market. When market declines, the demand for puts usually increases & Increased demand means higher put prices & higher implied volatilities.
Comparing VIX action with that of the market can yield good clues on future direction or duration of a move. The further VIX increases in value, the more panic there is in the market. The further VIX decreases in value, the more complacency there is in the market.
Extremely low VIX readings indicate a high degree of complacency, and are generally regarded as BEARISH, readings below 20 as excessively bearish.
Conversely extremely high VIX readings indicate a high degree of panic among options traders, and are regarded at BULLISH.
High VIX readings usually occur after an extended or sharp decline and sentiment is still quite bearish? & readings above 30 as bullish.
Conflicting signals between VIX and the market can also yield sentiment clues for the short term. Overly bullish sentiment or complacency is regarded as bearish On the other hand, overly bearish sentiment or panic is regarded as bullish.
If the market declines sharply and VIX remains unchanged or decreases in value (towards complacency),( like on 25th may ) it could indicate that the decline has further to go.
Contrarians might take the view that there is still not enough bearishness or panic in the market to warrant a bottom. If the market advances sharply and VIX increases in value (towards panic), it could indicate that the advance has further to go. Contrarians might take the view that there is not enough bullishness or complacency to warrant a top.
Courtesy to stock chart.com
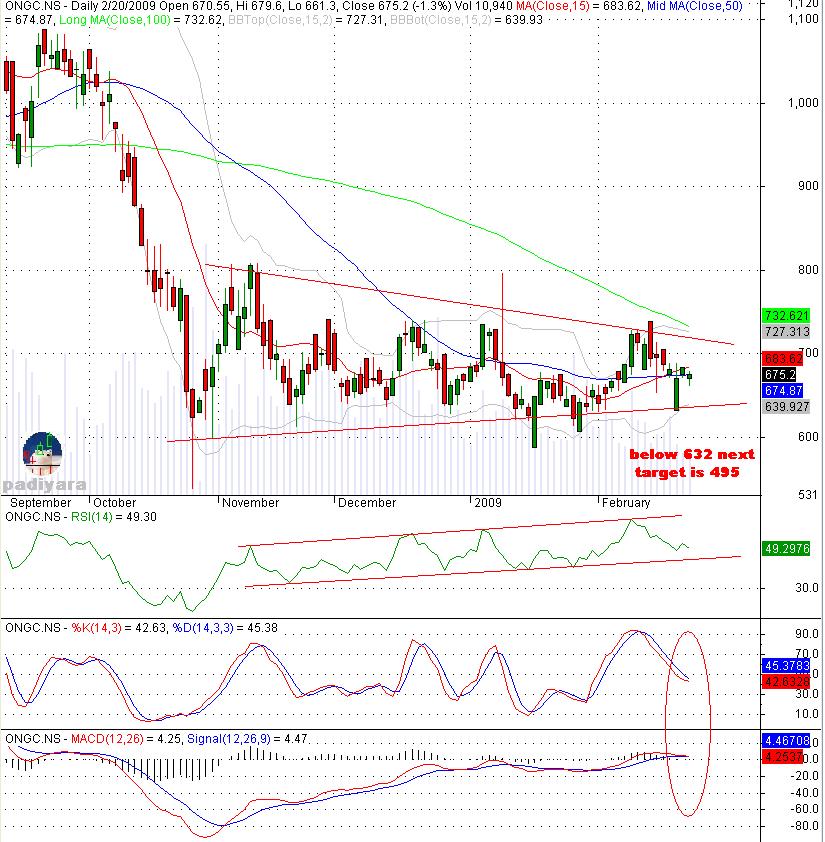
 Wanted to see how the Giant with a bearish out look will perform in this euphoric thrust.
ONGC Target 680
Wanted to see how the Giant with a bearish out look will perform in this euphoric thrust.
ONGC Target 680
 Many were asking about VIX chart here you have an easy way to access , click on the link or cut & paste the follwing,& add to favorites , for further updates change the date in the address bar in same format next time.
http://www.nseindia.com/marketinfo/charting/HistVIXChart.jsp?from_date=02042007&to_date=17042009
Many were asking about VIX chart here you have an easy way to access , click on the link or cut & paste the follwing,& add to favorites , for further updates change the date in the address bar in same format next time.
http://www.nseindia.com/marketinfo/charting/HistVIXChart.jsp?from_date=02042007&to_date=17042009
Gann Dates falling from the bottom 7511 on 24/3/2020


