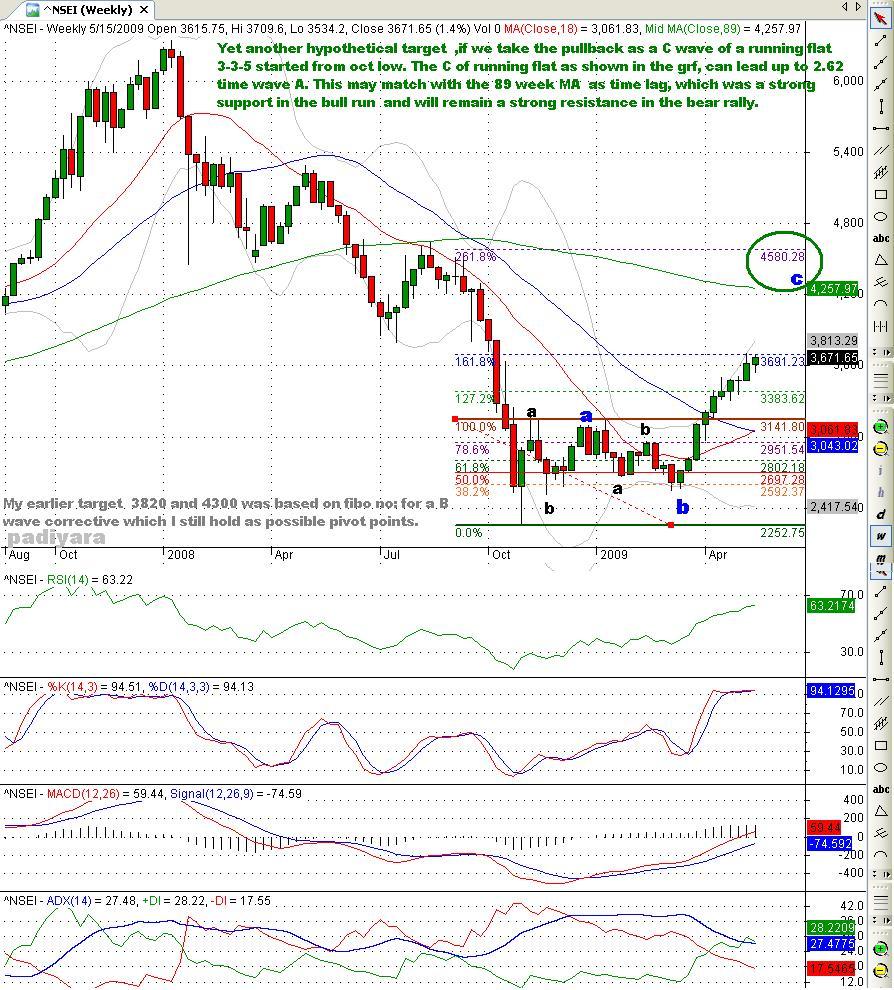
Yet another hypothetical target ,if we take the pullback as a C wave of an irregular flat(not running flat as shown in the grf,) 3-3-5 started from oct low. The C of irregular flat can lead up to 2.62 time wave A. This may match with the 89 week MA as time lag, which was a strong support in the bull run and will remain a strong resistance in the bear rally.

Wanted to see how the Giant with a bearish out look will perform in this euphoric thrust.
ONGC Target 680

Many were asking about
VIX chart here you have an easy way to access , click on the link or cut & paste the follwing,& add to favorites , for further updates change the date in the address bar in same format next time.
http://www.nseindia.com/marketinfo/charting/HistVIXChart.jsp?from_date=02042007&to_date=17042009
 Wanted to see how the Giant with a bearish out look will perform in this euphoric thrust.
ONGC Target 680
Wanted to see how the Giant with a bearish out look will perform in this euphoric thrust.
ONGC Target 680
 Many were asking about VIX chart here you have an easy way to access , click on the link or cut & paste the follwing,& add to favorites , for further updates change the date in the address bar in same format next time.
http://www.nseindia.com/marketinfo/charting/HistVIXChart.jsp?from_date=02042007&to_date=17042009
Many were asking about VIX chart here you have an easy way to access , click on the link or cut & paste the follwing,& add to favorites , for further updates change the date in the address bar in same format next time.
http://www.nseindia.com/marketinfo/charting/HistVIXChart.jsp?from_date=02042007&to_date=17042009


2 comments:
DEAR SIR
I GREAT FOLLLOWER U R TECHNICAL , B.COZ YOU WHERE PERSON WHO EXACTLY PERDICTED 3800 OR 4300 NIFTY TGT IF WE CROSSS 3050, ALL OTHER ANALYST JUST GIVE GUESSING NUMBER IF OR NOT LIKE THAT , BUT U WHERE SURE MKT WILL BOUNCE TO 3800 OR 4300 LEVEL , NOW IF WE SEE U WHERE TELLING TGT OF 6800 FOR BSE , CAN I KNOW STILL THIS LEVEL IS VALID OR WE HAVE STARTED NEW BULL N IF WE STARTED NE BULL RUN THEN WAT IS TGT FOR BSE IN LT 3-5 YRS , ALSO IF POSSIBLE CAN U LET ME KNOW FEW A GROUP STK TECHNICAL LEVEL ROM WHERE TO SHORT N WHERE TO COVER , IF POSSIBLE ADD MY YAHOO ID , krppijain@yahoo.com
great work sir , n sir in gold chart kindly put some advice , b.coz we retail investor do:nt understand graph easily
tx for u r timely sppt to our retail community
arvind jain
Yes 6800 is still a bottom target for BSE sensex, I believe that we are in bear market and not in the start of bull run and what we see the rise in the market is and impulse wave with in the corrective wave. Here the negation point s
First The 89 week moving average which comes around 4300, reason the market was bullish above this mark and falls in to bear grip below that level hence that level should act as a strong resistance in a major pull back.
Second is 4580 shown in the pervious post, reason “c” in expanded/ irregular flat cannot go beyond 2.62 time “a”, and if it move past that level we can consider the move as a new impulse.(if my count is correct?)
and ,the 3 rd and my final level is 4780 , that is 61.8% of the total fall and I understand that B in an expected zigzag cannot go more.
My knowledge is limited, there can be many argument for level, chart pattern, wave sruture& degree etc, but one should be able to understand that where we stand now. And if the recession is comparable to 1926 and all, who saw the history just count the severity? Are we not in deep woods. Now the Govt is strong and is it not in the same regime we fall deep? I stick to my earlier views that the correction will show all its colors and will be a long lasting one.
Ok if bull run started the we will see 21200 before 2009 and 24880 in three and 29555 in five years
Due to time constrain, I am not able to prepare more than what I post and not able to go in search of individual stock.
Your ID can be a added but many a friends added me in the friends list and I am not able to present any thing more.
the Goldchart is a web feed updates you can get the current price level not any forcest, a possible Gold levels can be given in the posts, but don’t forget the title in my blog and the usual disclaimer when you are going to invest your hard earned money, take your own decision for and entry and exit.
Thanks for the appreciation.
Post a Comment