Sunday, June 21, 2009


Monday, June 15, 2009
Sunday, May 31, 2009
Monday, May 25, 2009
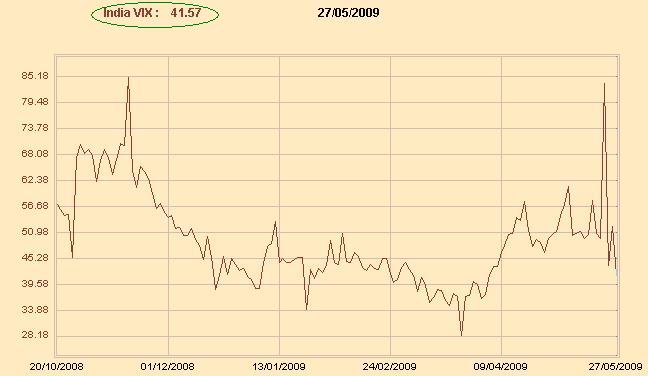
 The value of VIX increases when the market declines and decreases when the market rises,as the rising stock market is viewed as less risky, and a declining stock market more risky.
The higher the perceived risk is in stocks, the higher the implied volatility and the more expensive the associated options, especially puts,Hence, implied volatility is not about the size of the price swings, but rather the implied risk associated with the stock market. When market declines, the demand for puts usually increases & Increased demand means higher put prices & higher implied volatilities.
Comparing VIX action with that of the market can yield good clues on future direction or duration of a move. The further VIX increases in value, the more panic there is in the market. The further VIX decreases in value, the more complacency there is in the market.
Extremely low VIX readings indicate a high degree of complacency, and are generally regarded as BEARISH, readings below 20 as excessively bearish.
Conversely extremely high VIX readings indicate a high degree of panic among options traders, and are regarded at BULLISH.
High VIX readings usually occur after an extended or sharp decline and sentiment is still quite bearish? & readings above 30 as bullish.
Conflicting signals between VIX and the market can also yield sentiment clues for the short term. Overly bullish sentiment or complacency is regarded as bearish On the other hand, overly bearish sentiment or panic is regarded as bullish.
If the market declines sharply and VIX remains unchanged or decreases in value (towards complacency),( like on 25th may ) it could indicate that the decline has further to go.
Contrarians might take the view that there is still not enough bearishness or panic in the market to warrant a bottom. If the market advances sharply and VIX increases in value (towards panic), it could indicate that the advance has further to go. Contrarians might take the view that there is not enough bullishness or complacency to warrant a top.
Courtesy to stock chart.com
The value of VIX increases when the market declines and decreases when the market rises,as the rising stock market is viewed as less risky, and a declining stock market more risky.
The higher the perceived risk is in stocks, the higher the implied volatility and the more expensive the associated options, especially puts,Hence, implied volatility is not about the size of the price swings, but rather the implied risk associated with the stock market. When market declines, the demand for puts usually increases & Increased demand means higher put prices & higher implied volatilities.
Comparing VIX action with that of the market can yield good clues on future direction or duration of a move. The further VIX increases in value, the more panic there is in the market. The further VIX decreases in value, the more complacency there is in the market.
Extremely low VIX readings indicate a high degree of complacency, and are generally regarded as BEARISH, readings below 20 as excessively bearish.
Conversely extremely high VIX readings indicate a high degree of panic among options traders, and are regarded at BULLISH.
High VIX readings usually occur after an extended or sharp decline and sentiment is still quite bearish? & readings above 30 as bullish.
Conflicting signals between VIX and the market can also yield sentiment clues for the short term. Overly bullish sentiment or complacency is regarded as bearish On the other hand, overly bearish sentiment or panic is regarded as bullish.
If the market declines sharply and VIX remains unchanged or decreases in value (towards complacency),( like on 25th may ) it could indicate that the decline has further to go.
Contrarians might take the view that there is still not enough bearishness or panic in the market to warrant a bottom. If the market advances sharply and VIX increases in value (towards panic), it could indicate that the advance has further to go. Contrarians might take the view that there is not enough bullishness or complacency to warrant a top.
Courtesy to stock chart.com
Sunday, May 24, 2009

Monday, May 18, 2009


Sunday, May 17, 2009
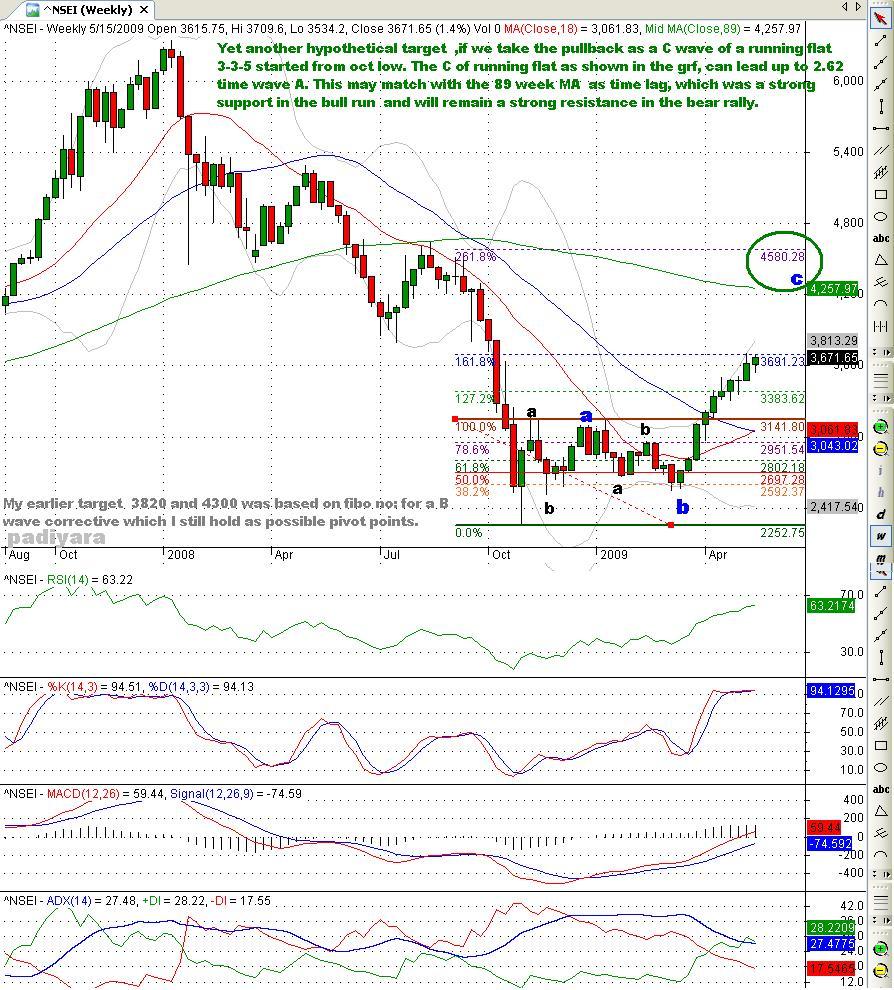
Yet another hypothetical target ,if we take the pullback as a C wave of an irregular flat(not running flat as shown in the grf,) 3-3-5 started from oct low. The C of irregular flat can lead up to 2.62 time wave A. This may match with the 89 week MA as time lag, which was a strong support in the bull run and will remain a strong resistance in the bear rally.
 Wanted to see how the Giant with a bearish out look will perform in this euphoric thrust.
ONGC Target 680
Wanted to see how the Giant with a bearish out look will perform in this euphoric thrust.
ONGC Target 680
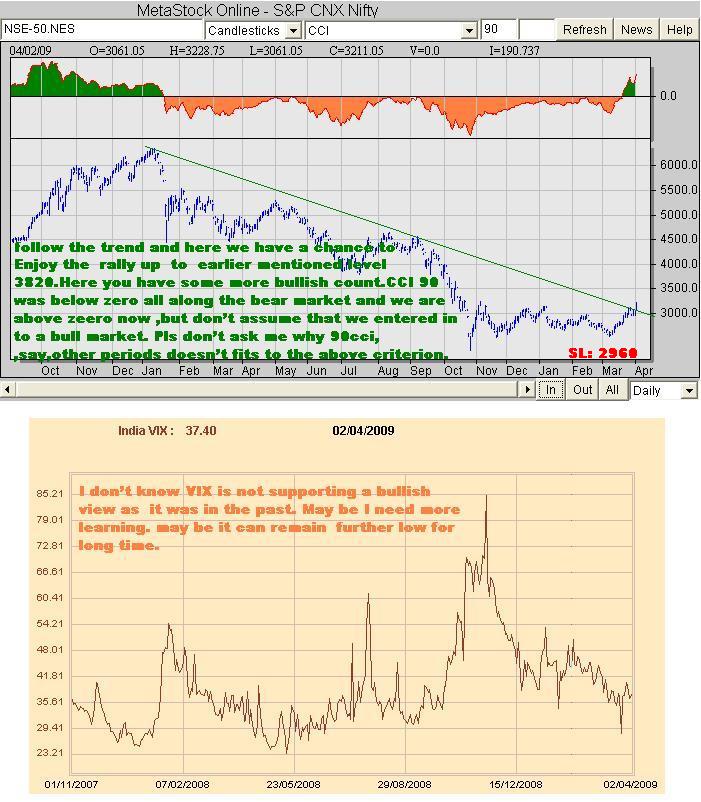
 Many were asking about VIX chart here you have an easy way to access , click on the link or cut & paste the follwing,& add to favorites , for further updates change the date in the address bar in same format next time.
http://www.nseindia.com/marketinfo/charting/HistVIXChart.jsp?from_date=02042007&to_date=17042009
Many were asking about VIX chart here you have an easy way to access , click on the link or cut & paste the follwing,& add to favorites , for further updates change the date in the address bar in same format next time.
http://www.nseindia.com/marketinfo/charting/HistVIXChart.jsp?from_date=02042007&to_date=17042009
 Wanted to see how the Giant with a bearish out look will perform in this euphoric thrust.
ONGC Target 680
Wanted to see how the Giant with a bearish out look will perform in this euphoric thrust.
ONGC Target 680
 Many were asking about VIX chart here you have an easy way to access , click on the link or cut & paste the follwing,& add to favorites , for further updates change the date in the address bar in same format next time.
http://www.nseindia.com/marketinfo/charting/HistVIXChart.jsp?from_date=02042007&to_date=17042009
Many were asking about VIX chart here you have an easy way to access , click on the link or cut & paste the follwing,& add to favorites , for further updates change the date in the address bar in same format next time.
http://www.nseindia.com/marketinfo/charting/HistVIXChart.jsp?from_date=02042007&to_date=17042009
Thursday, April 16, 2009
nifty_MA
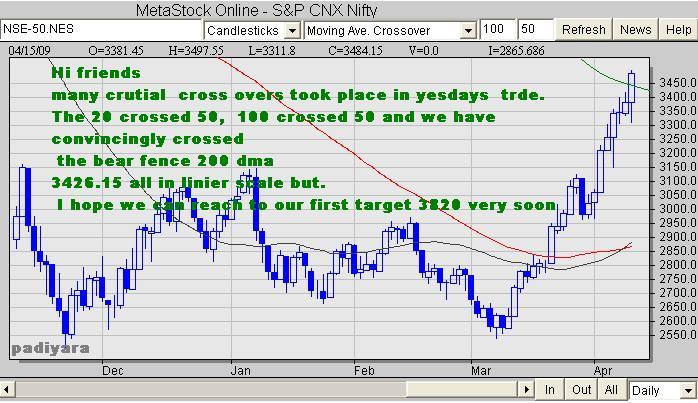
Hi friends
many crutial cross overs took place in yesdays trde.
The 20 crossed 50, 100 crossed 50 and we have convincingly crossed
the bear fence 200 dma
3426.15 all in linier scale but.
I hope we can reach to our first target 3820 very soon

Sunday, April 05, 2009

Sunday, March 29, 2009
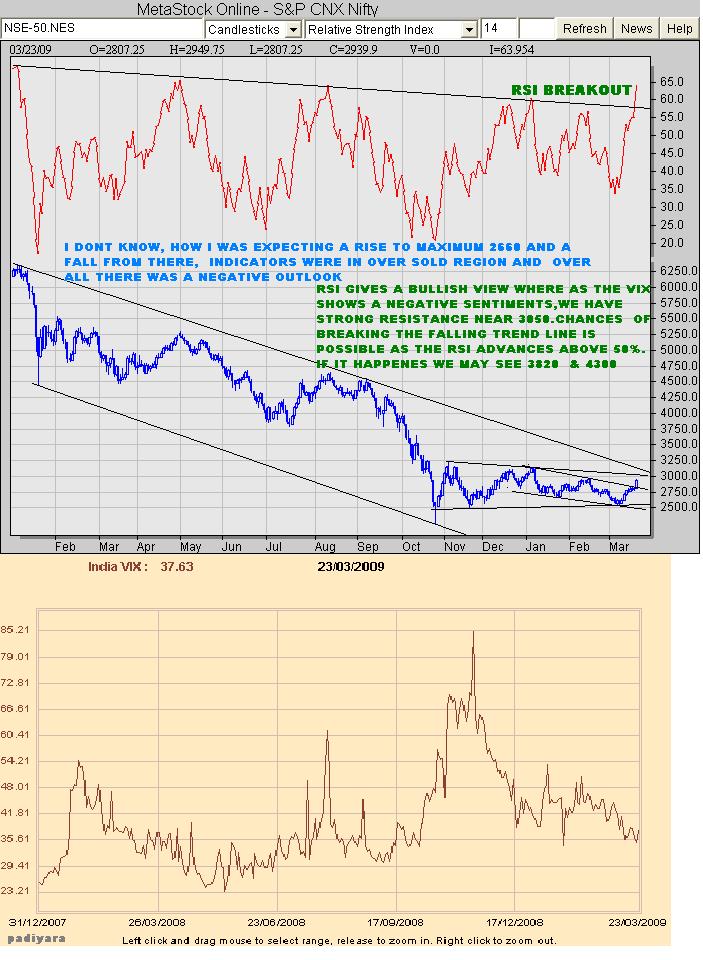
Nifty_current outlook
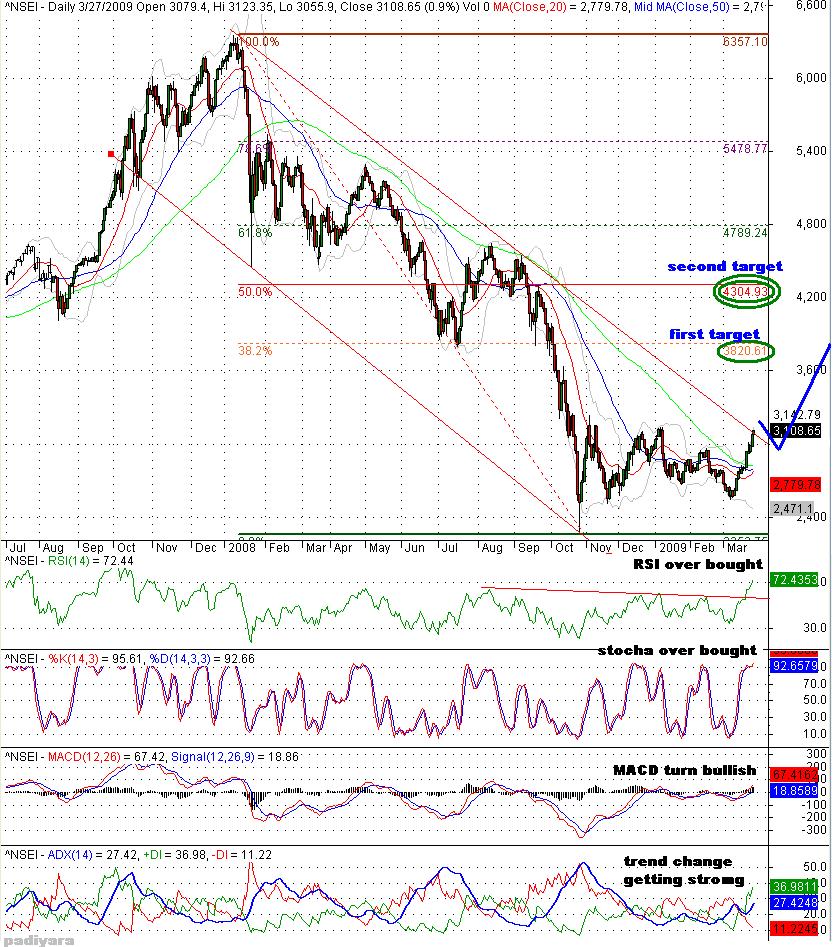
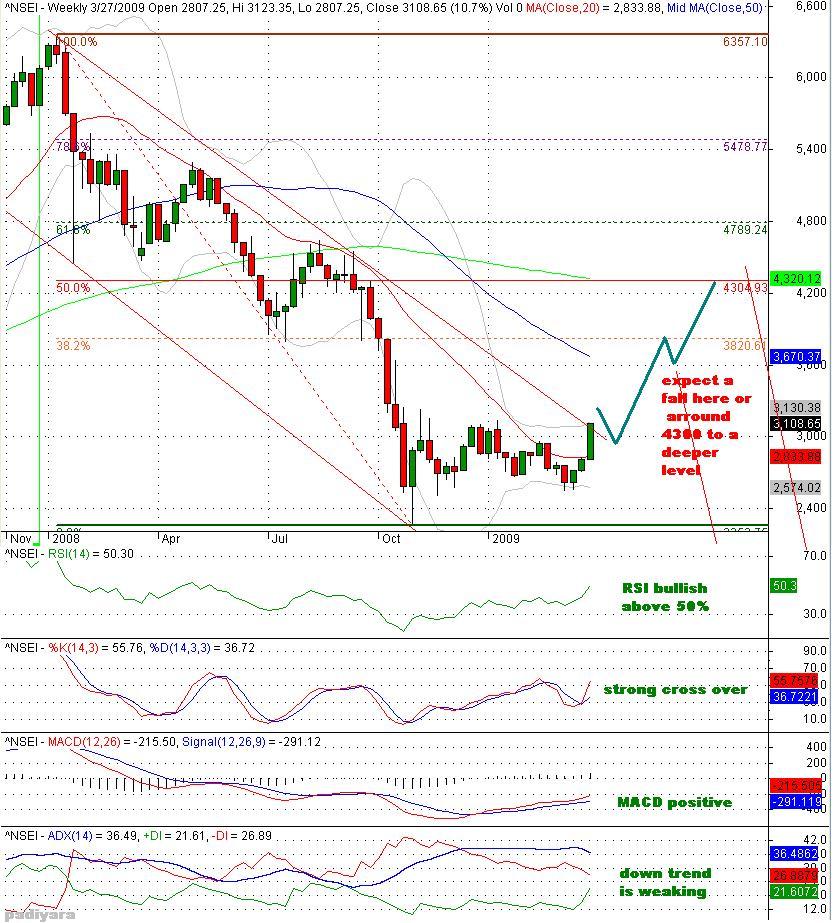
We can see a breakout in price from the falling trend and already there was a breakout in 14 period RSI last week. If the price can sustain above the trend line we may see 38.2% & 50% rise of the total fall from January ‘08


Wednesday, March 11, 2009
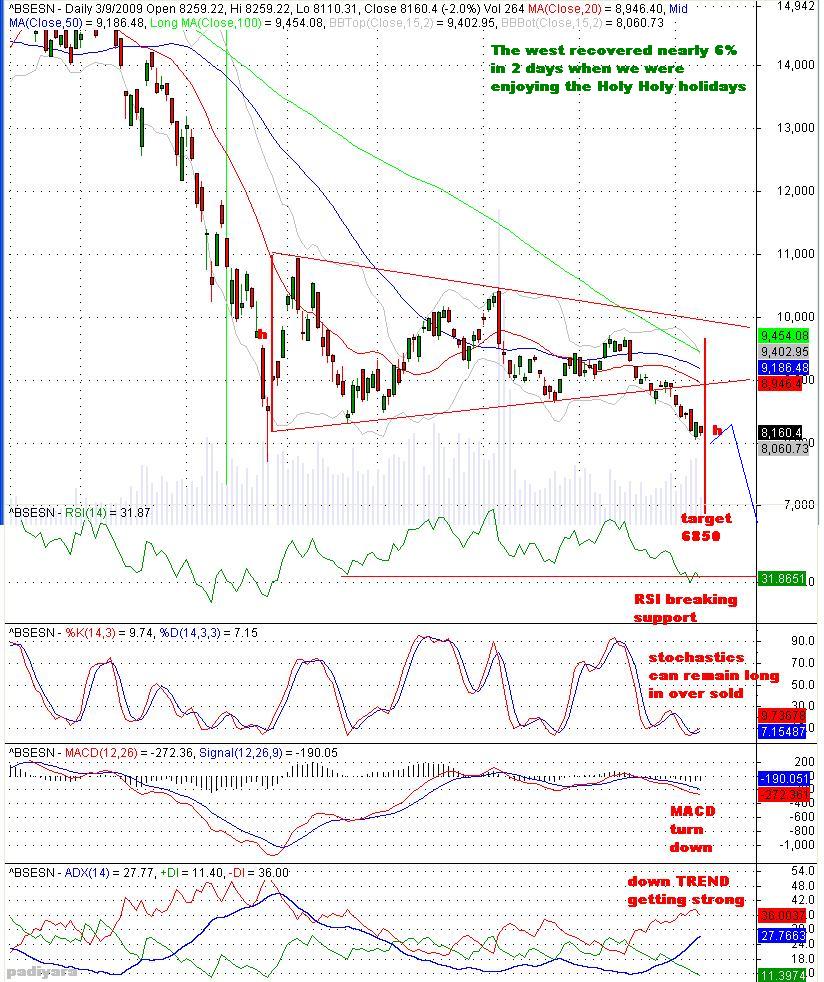
my view on sensex
My target for sensex 6800 remain unchanged
The west recovered nearly 6% in 2 days when we were enjoying the Holy Holy holidays

Monday, March 09, 2009
down trend contd...
Halo friends,
The down trend is getting strong. I was chking the adx indicator and find no bewilderment we ar ein right path. Negative directional indicator is crossed above positive and nnow the average is moving above 20% getting stronger.
Friday, March 06, 2009
Sunday, February 22, 2009

Saturday, February 14, 2009
Thursday, February 05, 2009

Saturday, January 31, 2009
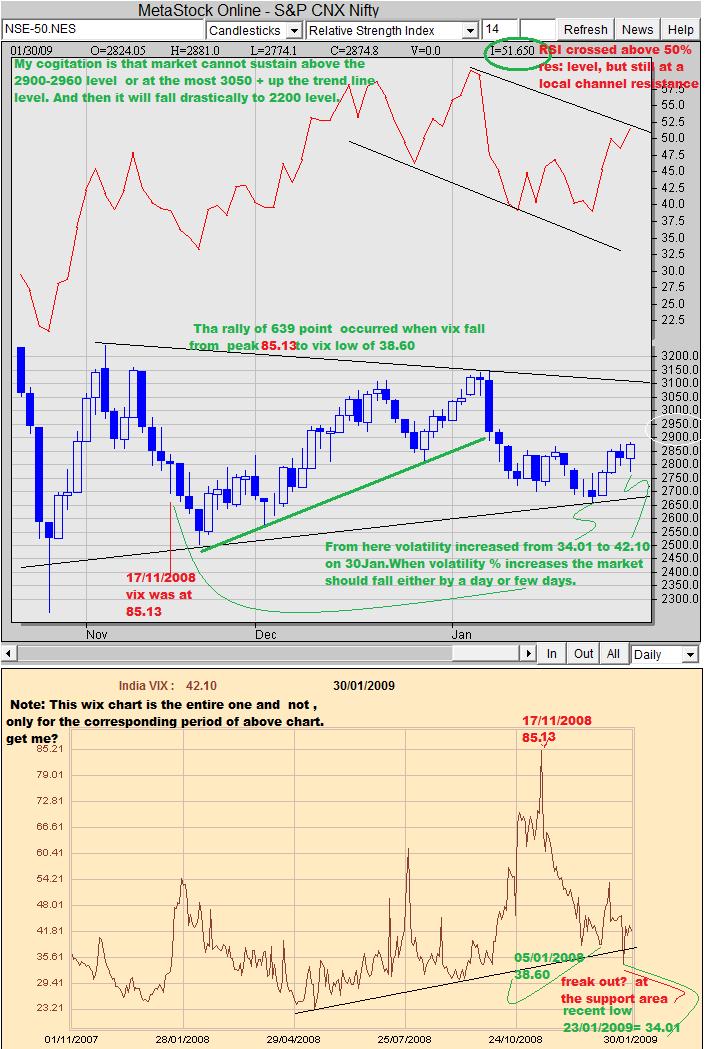
nifty & vix
Dear Friends

My cogitation is that market cannot sustain above the 2900-2960 level or at the most 3050 + up the trend line level. And then it will fall drastically to 2200 level.
Saturday, January 17, 2009
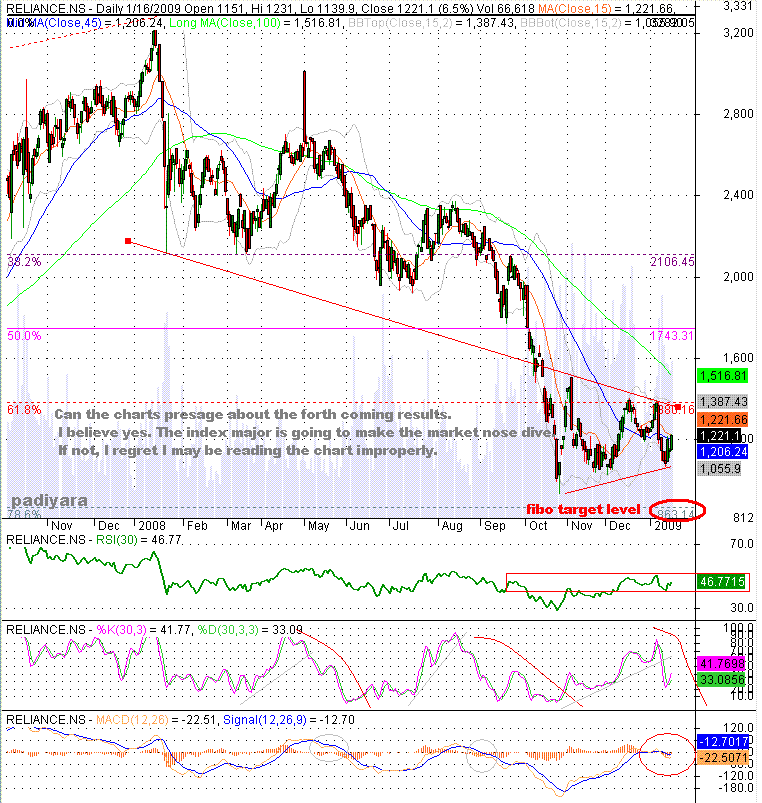
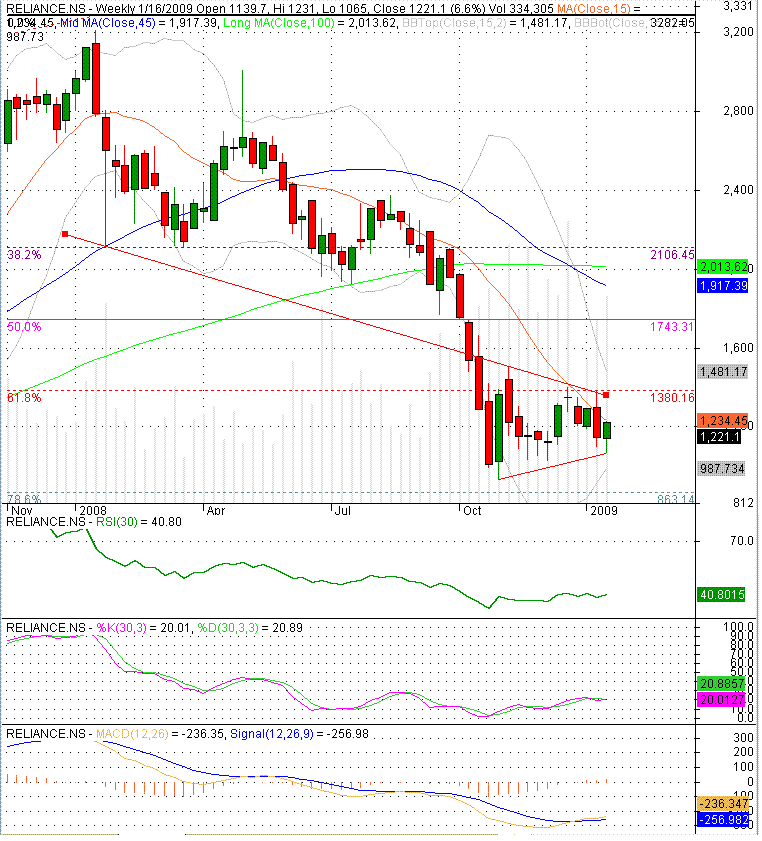
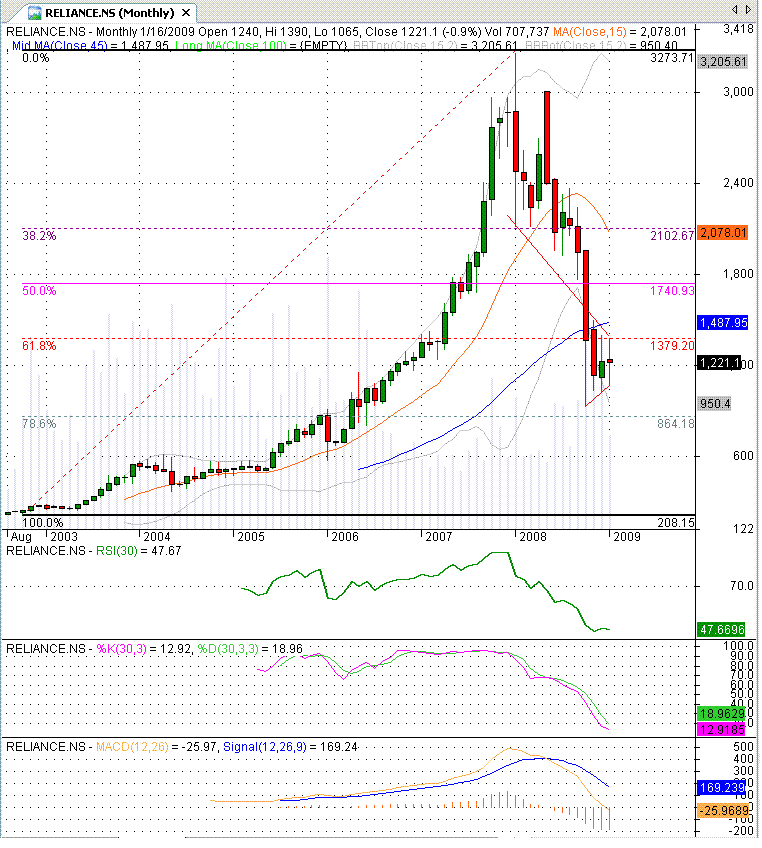
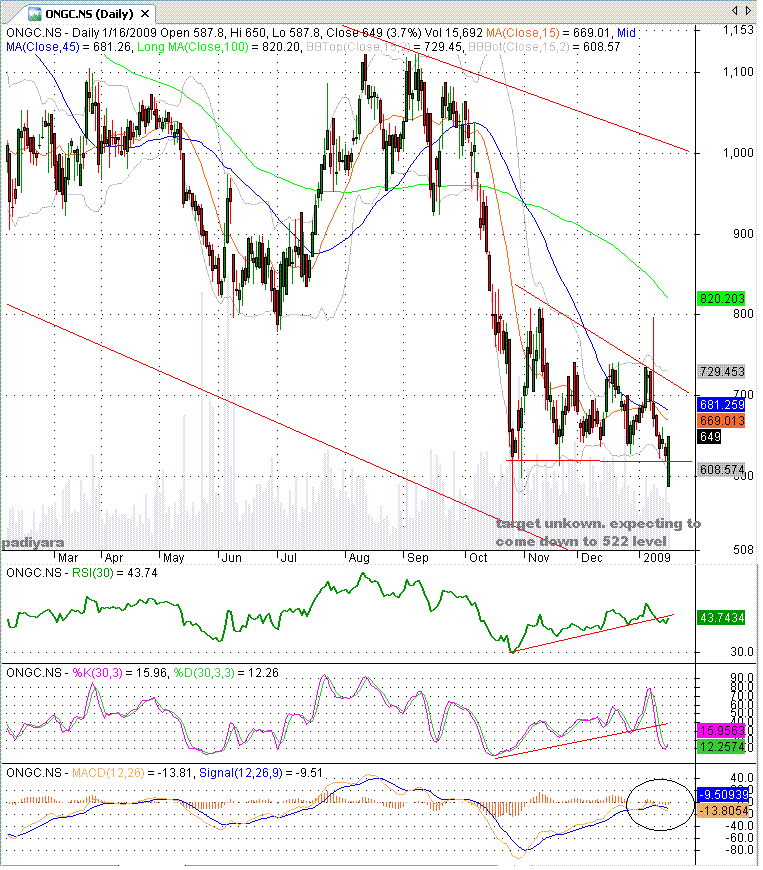

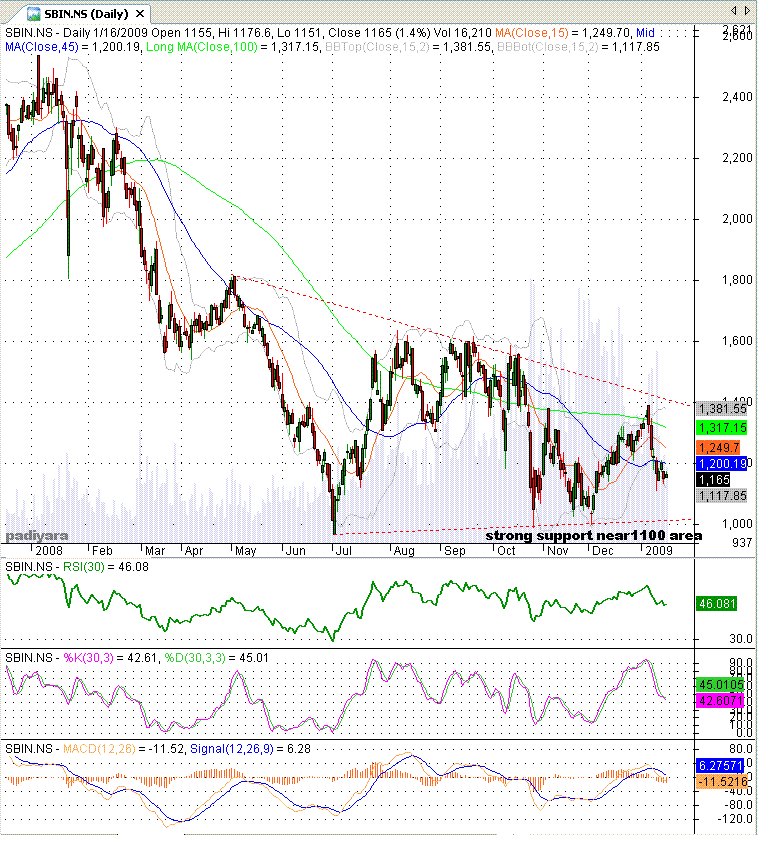
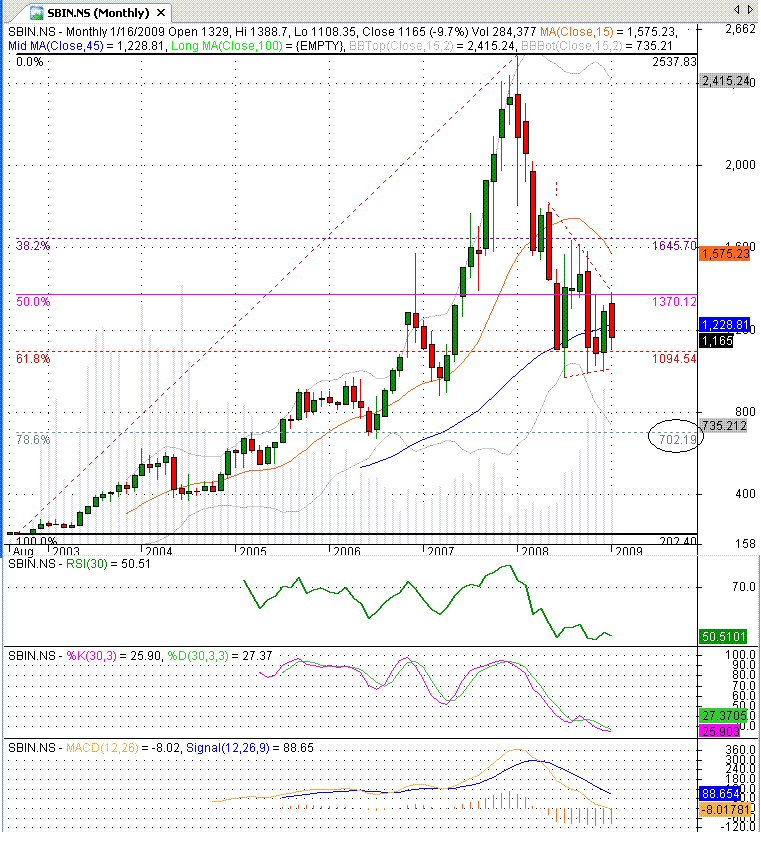
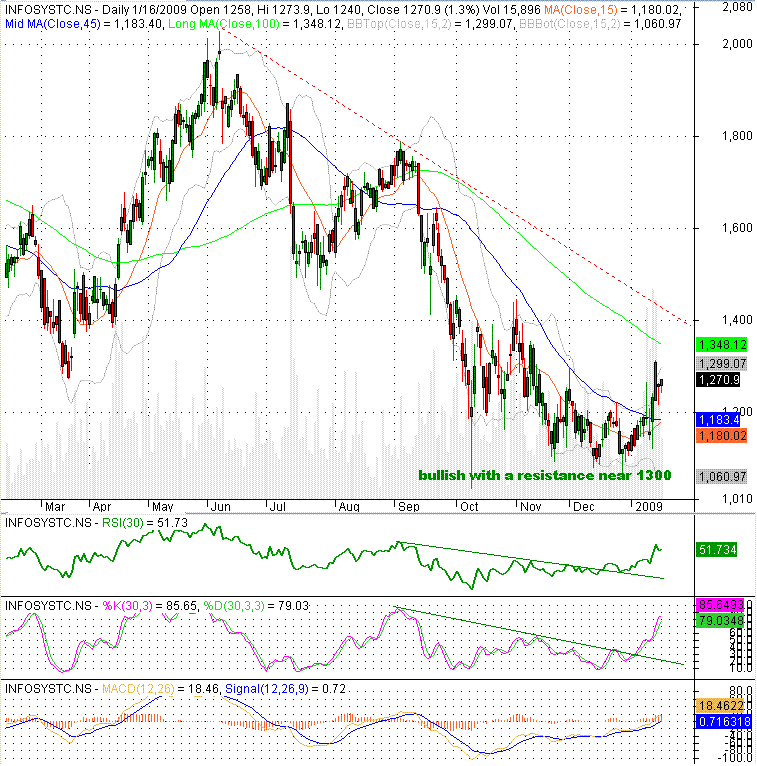

sensex_weekend view
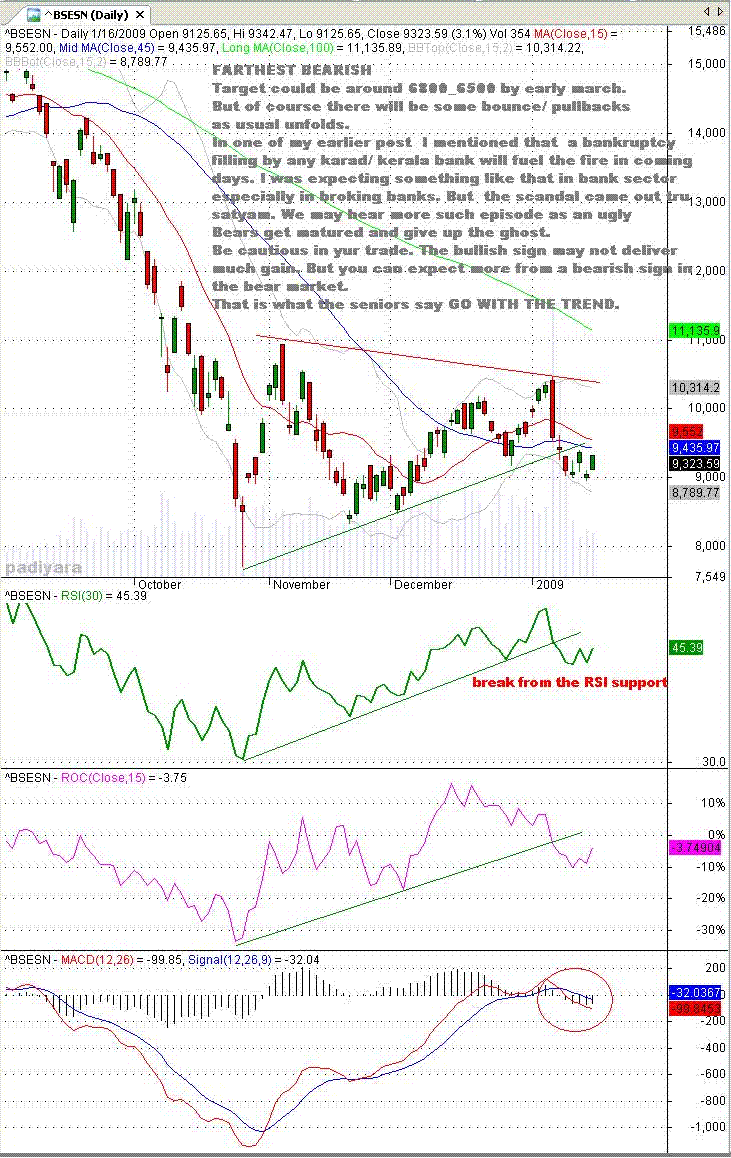
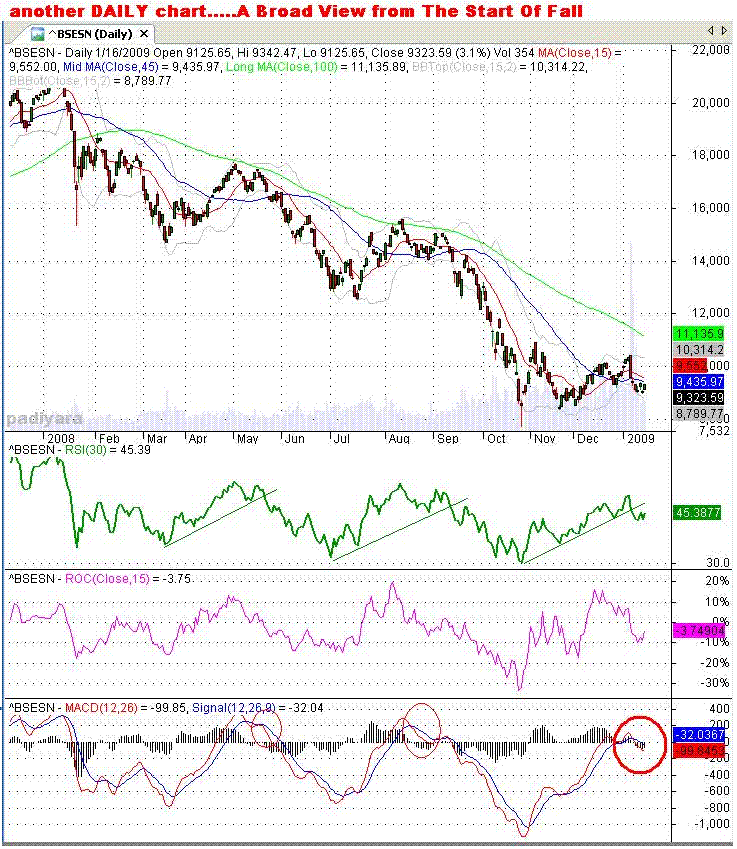
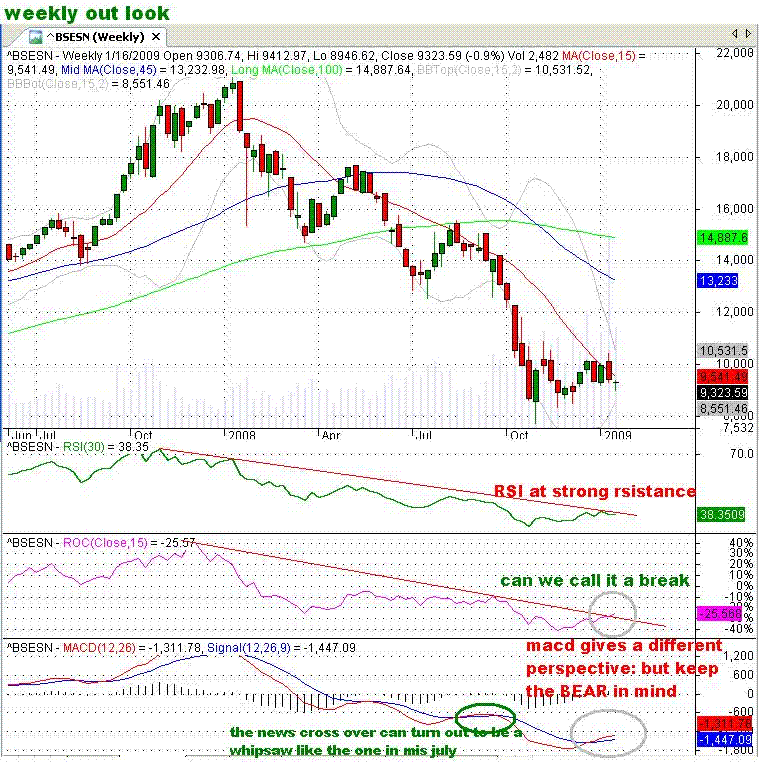
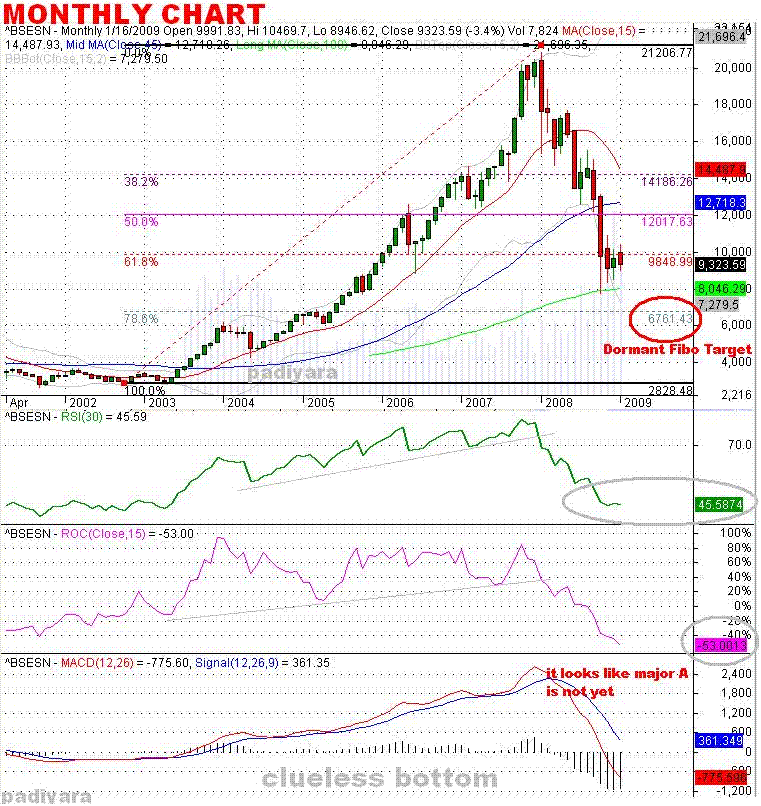
FARTHEST BEARISH
Target could be around 6800_6500 by early march.
But of course there will be some bounce/ pullbacks
as usual unfolds.
In one of my earlier post I mentioned that a bankruptcy filling by any karad/ kerala bank will fuel the fire in coming days. I was expecting something like that in bank sector especially in broking banks. But the scandal came out tru satyam. We may hear more such episode as an ugly.Bears get matured and give up the ghost.
Be cautious in yur trade. The bullish sign may not deliver much gain.
But you can expect more in a bearish sign in the bear market. That is what the seniors say GO WITH THE TREND


Subscribe to:
Posts (Atom)
Gann Date combination for Nifty from 7511 bottom on 24.march 2020
Gann Dates falling from the bottom 7511 on 24/3/2020

-
 Natco Pharma Ltd: ₹706 Can come down to 50% retracement level, having a confluence with the bottom TL. Support: ₹600. Market Ca...