Thursday, October 30, 2008

why india viks?

see the price movemt after vix was at top and price movement after bottoms which you think is the greatest fall in the world? nayagra in US? the Angel? no.......... ......... .. ther is a new one in jappan

Tuesday, October 28, 2008

my view on sensex_target 6800

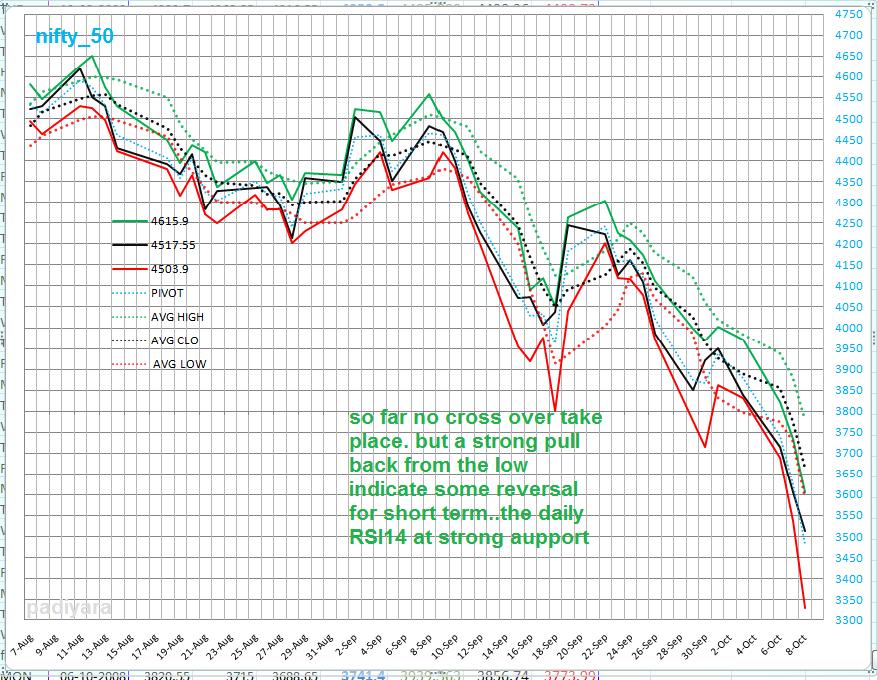
this was posted in group forums on26/10/2008.couldnt upload here due to net service problem. find ind dificultty in uploading picture here...with out a chart
the communication about stocks/ markets is very weak. 
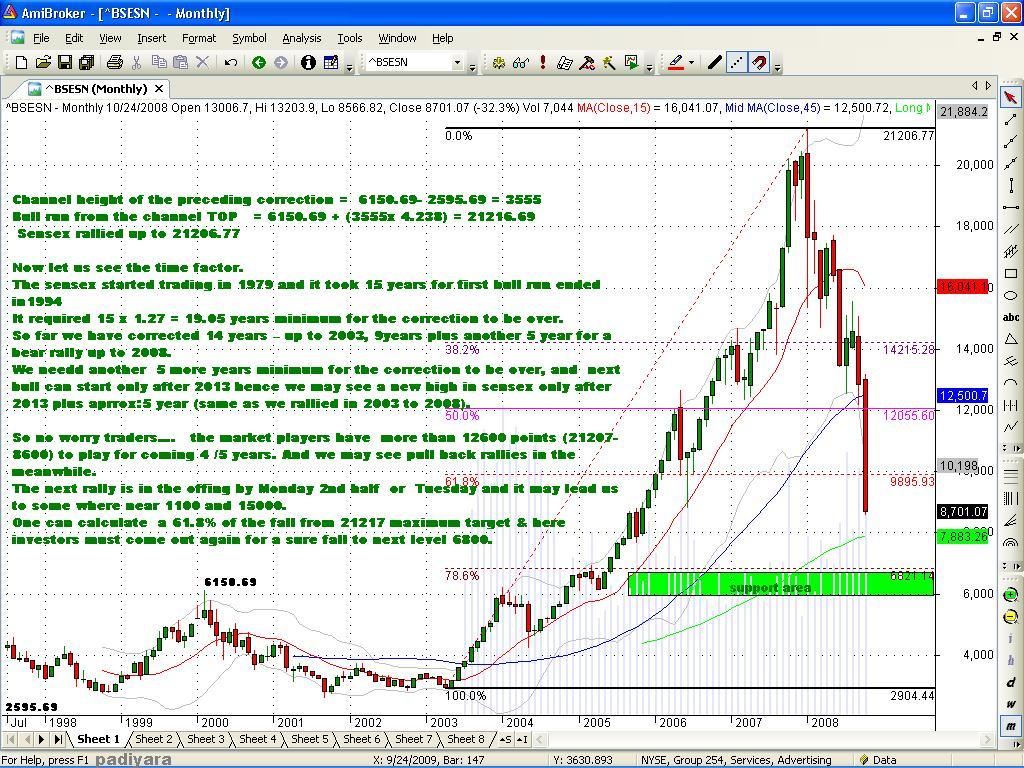
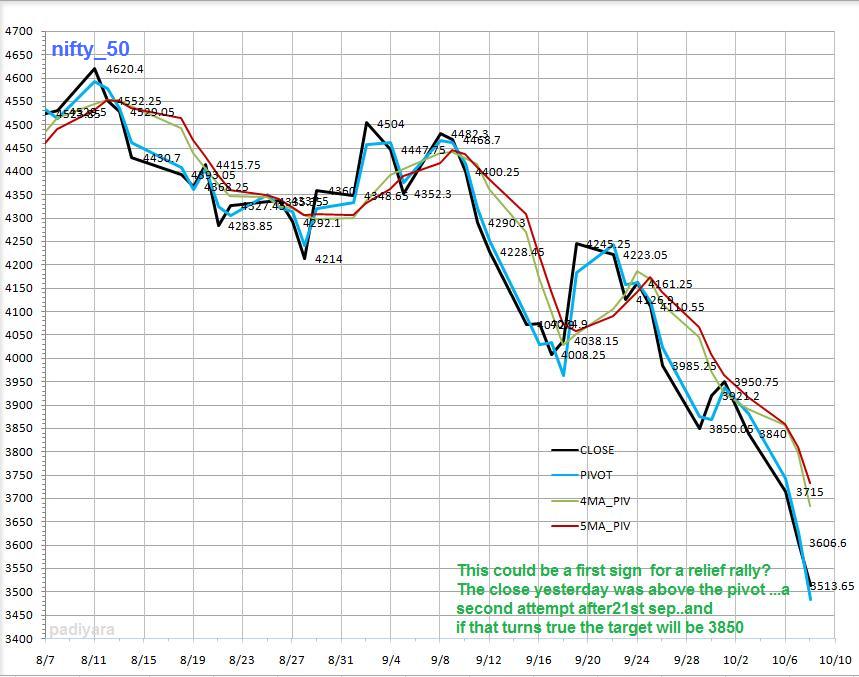
The next rally is in the offing by Monday 2nd half or Tuesday and it may lead us to some where near 11000 and then 15000. One can calculate a 61.8% of the fall from 21217 maximum target & here investors must come out again for a sure fall to next level 6800 Channel height of the preceding correction = 6150.69- 2595.69 = 3555 Bull run from the channel TOP = 6150.69 + (3555x 4.238) = 21216.69 Sensex rallied up to 21206.77 Now let us see the time factor. The sensex started trading in 1979 and it took 15 years for first bull run ended in1994 It required 15 x 1.27 = 19.05 years minimum for the correction to be over. So far we have corrected 14 years – up to 2003, 9years plus another 5 year for a bear rally up to 2008. We needd another 5 more years minimum for the correction to be over, and next bull can start only after 2013 hence we may see a new high in sensex only after 2013 plus aprrox:5 year (same as we rallied in 2003 to 2008). So no worry the traders…. the market players have more than 12600 points (21207- 8600) to play for coming 4 /5 years. And we may see pull back rallies in the meanwhile.
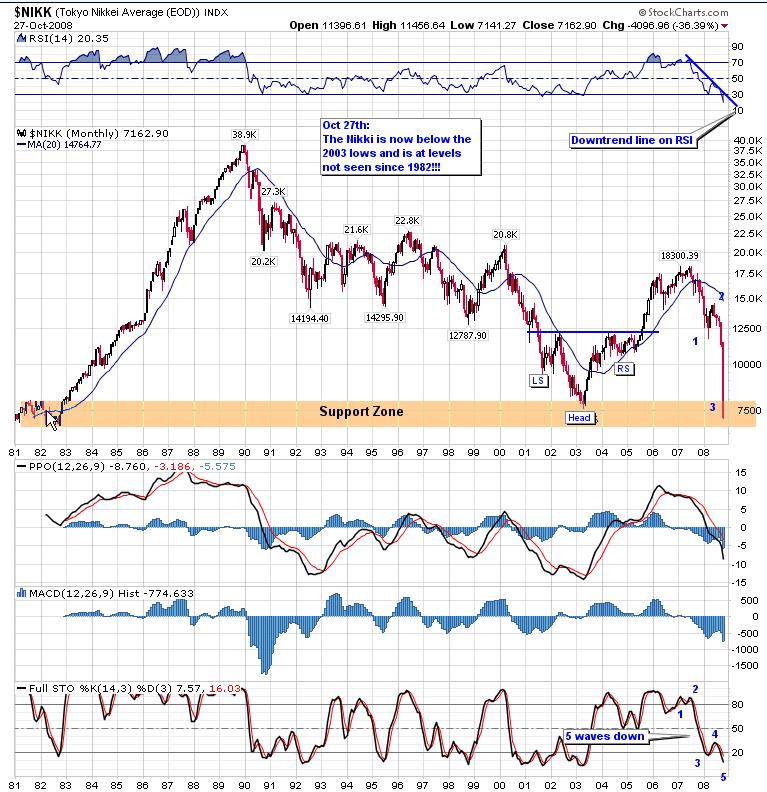
Thursday, October 09, 2008

MY VIEW ON NIFTY_FOR 10 OCT

A PULL BACK CAN BE EXPECTED FROM THIS LEVEL FOR A TARGET 3850 TO 4140 Contrarian view: If the bottom trend line on RSI drawn rightly, connecting the 2 pervious bottom, The RSI is having a breakout in downward direction. Also the price channel too have a down ward breakout .and horizontal RSI supp at 24 ie:2 point below the current level. taking the above in account if NIFTY trade below 3500 (yesterdays intraday support) it may further fall (1000 points channel height). But that can't happen all of a sudden in an oversold market. The west is still falling though I am expecting a small pull back up to Monday at least. Let us watch & see tomorrow.

Wednesday, August 13, 2008

BINDALAGRO

BINDAL AGRO is near the resistance of a falling trend line. RSI has got a positive divergence. Even though a negative sentiment prevailing in the market, the stock is hovering for a break out Technically &looks Good above 31.5 for a target: 42 in a month.
CMP: 30.75 TARGET: 42 STOP:28

Sunday, August 10, 2008

rpl_per request

To be honest , I am a leaner and not an expert in analyzing market or individual scrips, and my views have a 50/50 chance to become true , hence always take your own decision for trading, specially your holdings . since you have question here is my view. It looks like a failure of break out from a flag And another break out from a small ascending triangle to down wards Which can bring down the stock to 140 level soon

Wednesday, July 09, 2008

suzlon

Suzlon is a good buy at current level 196 Prices are turning from the bottom trend line An oversold pull back is awaiting in most of the stocks Target: 262 in one month Stoploss:174 suzlon

Tuesday, July 08, 2008

BSE_wed

Yesday it trade Exactly opposite to the previous day which shows selling pressure while yesterday it shows some buying interestToday’s range will be between 13300_13850 BSe_8708

BSE_tue (delayed post)

THIS PULL BACK MAY TAKE US TO 15160 that is approx: 50 % of the 2nd corrective A leg TOWARDS THAT LEVEVL WE HAVE MANY STRONG RESISTANCE AT 13731 & 14500 TODAYS RANGE WILL BE BETWEEN 13660_13120 MY FIRST TARGET FOR THIS FALL WAS 15300, 2ND WAS 14200 3RD IS 12100 AND THIS REMAIN INACTIVE UTILL IT PROVED BSE_8708

Monday, June 16, 2008

BSE_mon

Sensex may remain in positive range. Today’s levels: 15260_ 15300_ 15370 Above that market will be bullish for short term and may go to15420 support1: 15135 support2: 14750 below that market will be weak bse_8613

Gann Date combination for Nifty from 7511 bottom on 24.march 2020

 Gann Dates falling  from the bottom 7511 on 24/3/2020