Sunday, February 22, 2009
Saturday, February 14, 2009
Thursday, February 05, 2009
Saturday, January 31, 2009
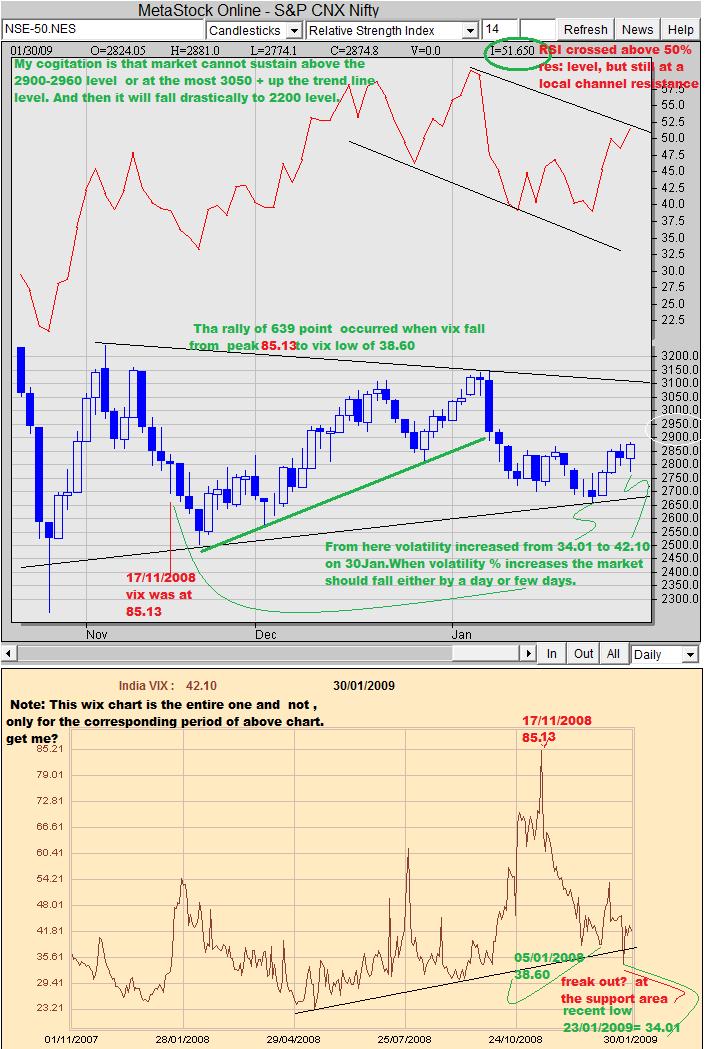
nifty & vix
Saturday, January 17, 2009
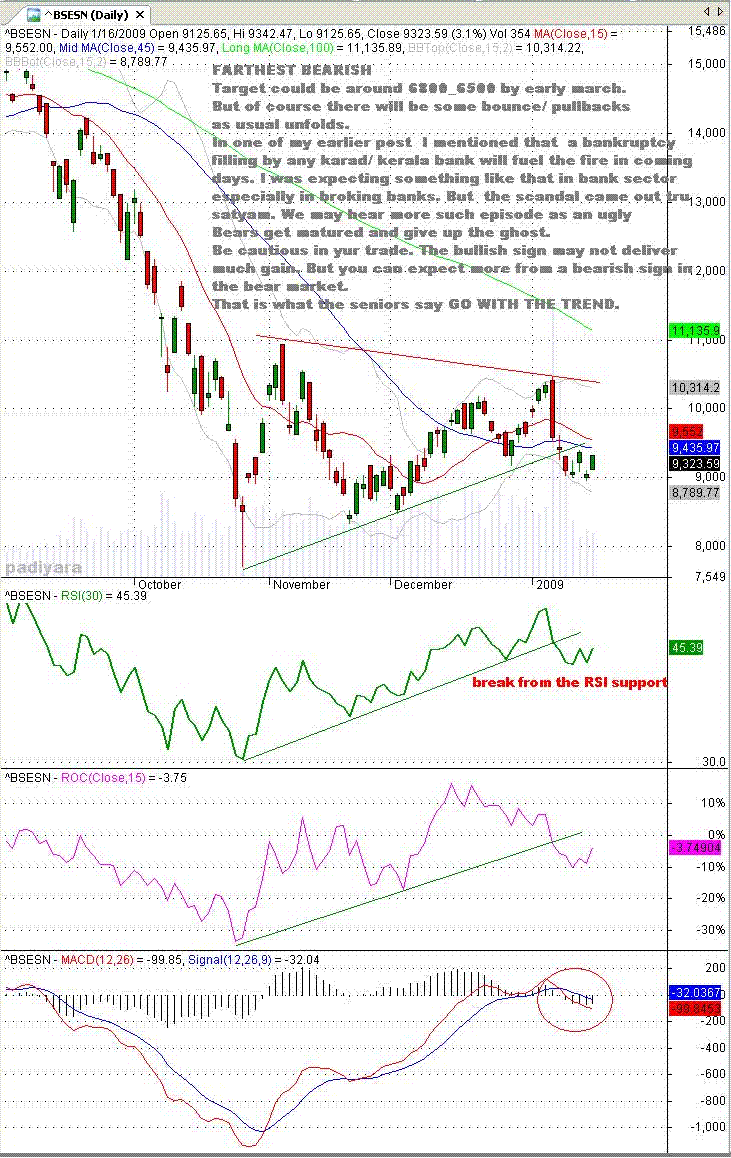
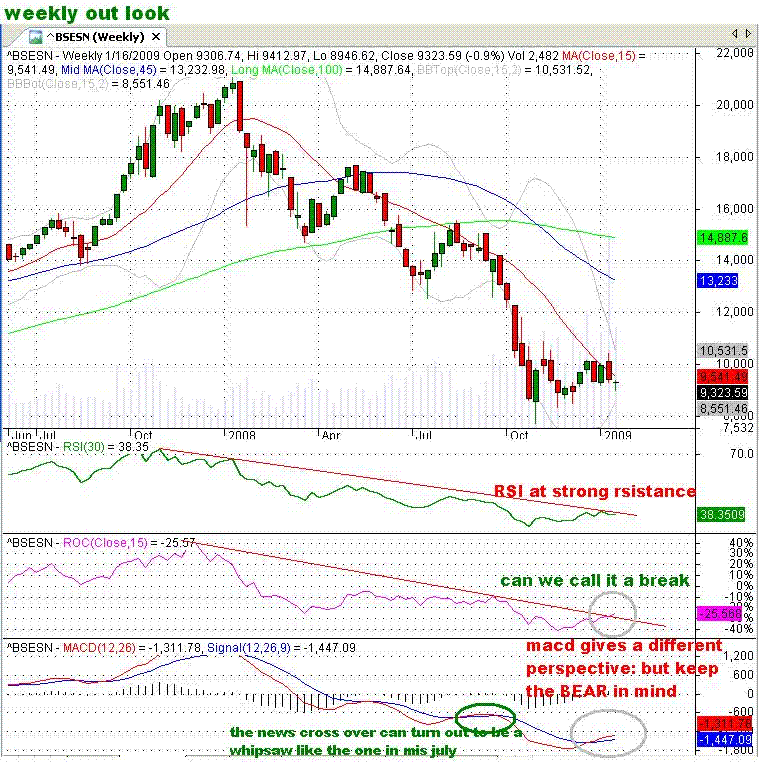
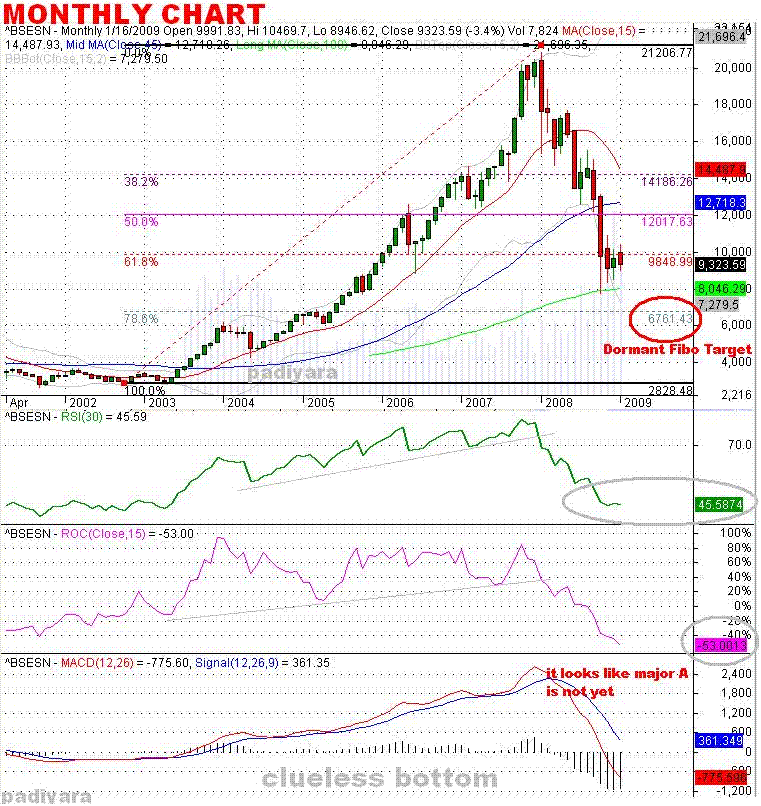
sensex_weekend view
FARTHEST BEARISH
Target could be around 6800_6500 by early march.
But of course there will be some bounce/ pullbacks
as usual unfolds.
In one of my earlier post I mentioned that a bankruptcy filling by any karad/ kerala bank will fuel the fire in coming days. I was expecting something like that in bank sector especially in broking banks. But the scandal came out tru satyam. We may hear more such episode as an ugly.Bears get matured and give up the ghost.
Be cautious in yur trade. The bullish sign may not deliver much gain.
But you can expect more in a bearish sign in the bear market. That is what the seniors say GO WITH THE TREND
Wednesday, January 14, 2009
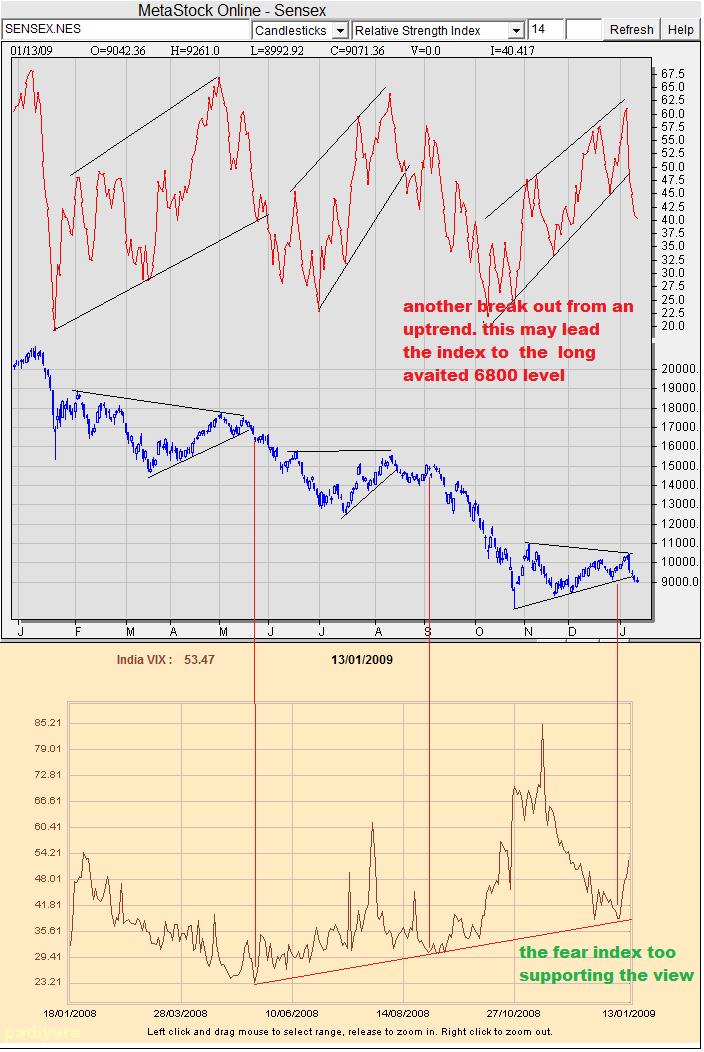
Next fall is imminent
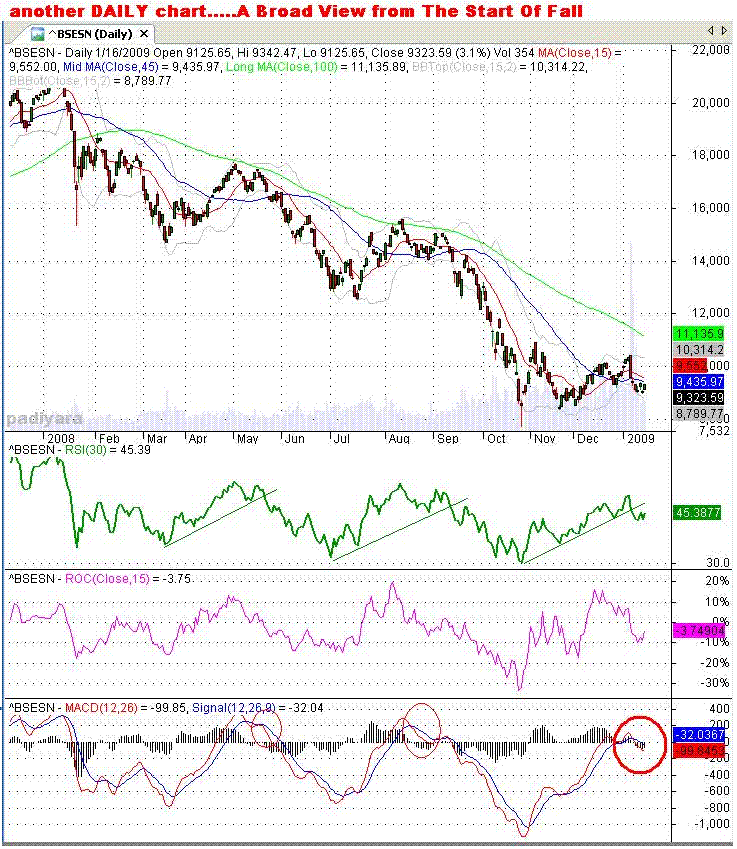
It is quiet accepted among TA’s that a bullish sign will not give good gain in a bear market, Where as a bearish sign will have strong impact in the price movement. That is what we have seen here in the last two uptrend marked with RSI channels, and of course there was three down trends breakout too ,from jan 08, but that didn’t make substantial gain. I am expecting the current break out (confirmed) from the up trend channel / triangle will take the sensex to the mach awaited 6800 level by early march.
Todays high was 9387.60 and the index is +170 points at the time of posting this blog. I was on an mid time vacation in DEC: and was so bored to make any posts. Any way I will refrain to post in groups to avoid blare which misplace my valuable time.
Saturday, November 15, 2008
Saturday, November 01, 2008
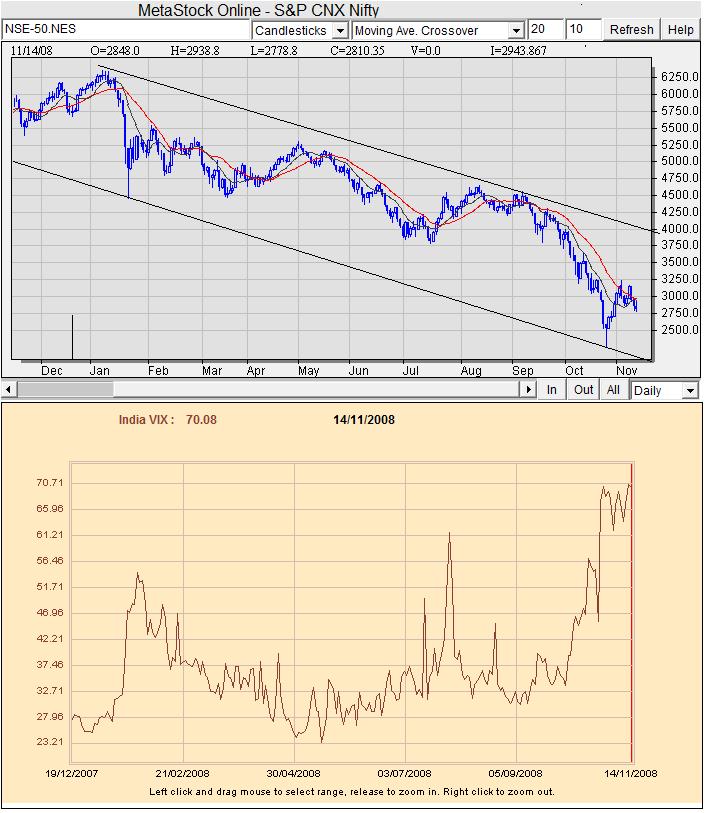
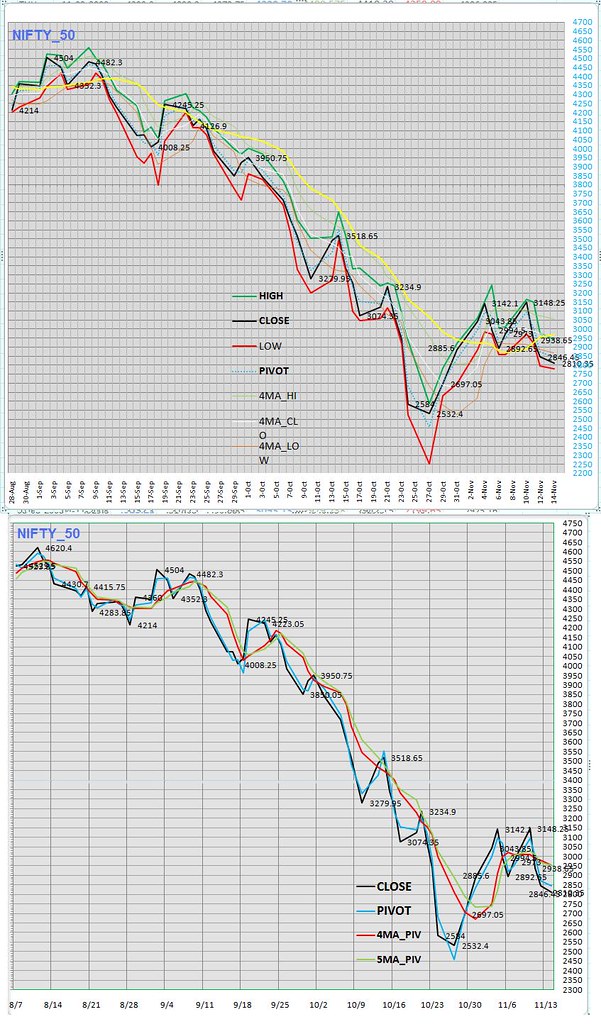
MOVING AVG CROSS OVER
Hi friends,
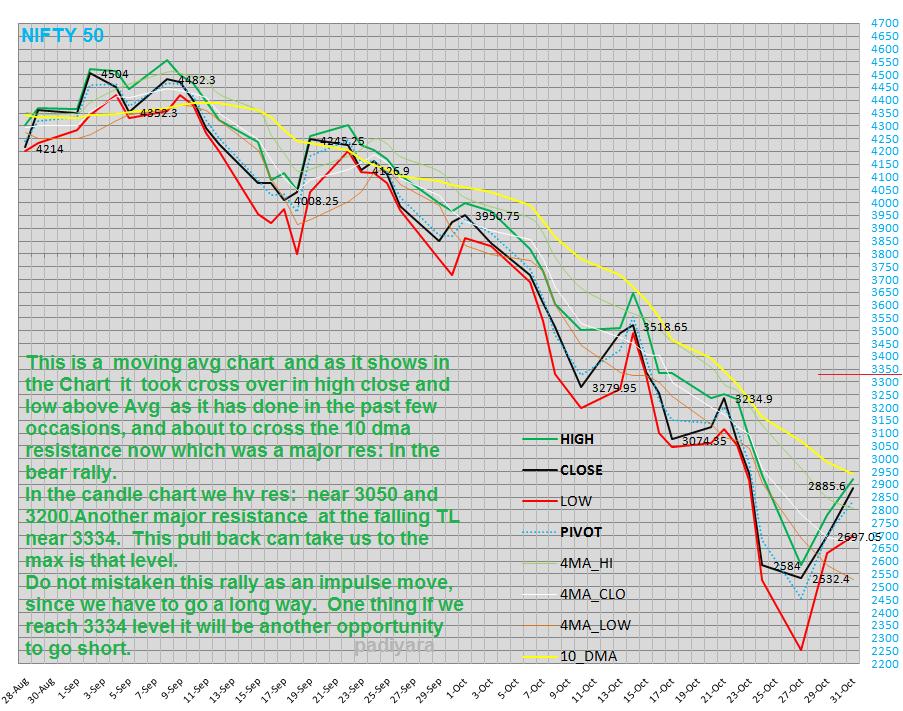
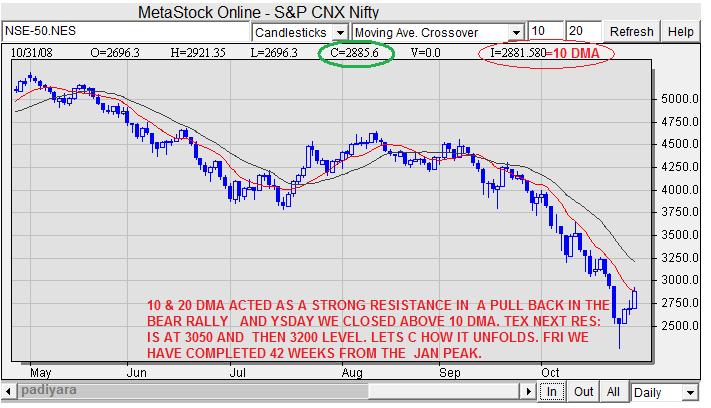
This is a moving avg chart and as it shows in the Chart it took cross over in high close and low above Avg as it has done in the past few occasions, and about to cross the 10 dma resistance now which was a major res: in the bear rally.
In the candle chart we hv res: near 3050 and 3200.Another major resistance at the falling TL near 3334. This pull back can take us to the max is that level.
Do not mistaken this rally as an impulse move, since we have to go a long way. One thing if we reach 3334 level it will be another opportunity to go short.
Earlier I use to mention this as “exit level”, but now there is no point in exiting at near bottom of market, albeit we have to go a long way but be neurotic long for at least for another five years to see a new peak. Let the consolidation take place. Let the market bottom out. Patiently wait for the market to cool after the retest of the bottoms. And then look for happy news to pour in from all economic statistics world around.
I feel thing are changed a lot about timing now, since the communication is so hasty and the deals are so hassle free. Only thing the money flow should be there. See the preceding impulse in five years it reached to 6357, where as in the past it was so gloomy.
So from where the money can flow in. From home we again need time to generate money.
Our forex is less by $16 bn. By time we remain weak the FIIs will come back with a supplementary gain they can make in the currency trade is expected, to loot again.
Thursday, October 30, 2008
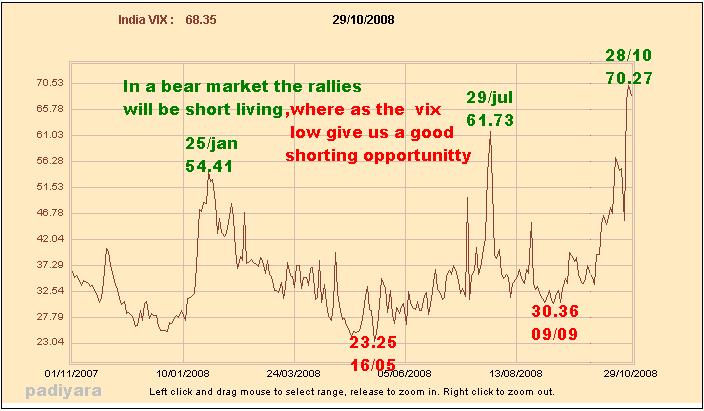
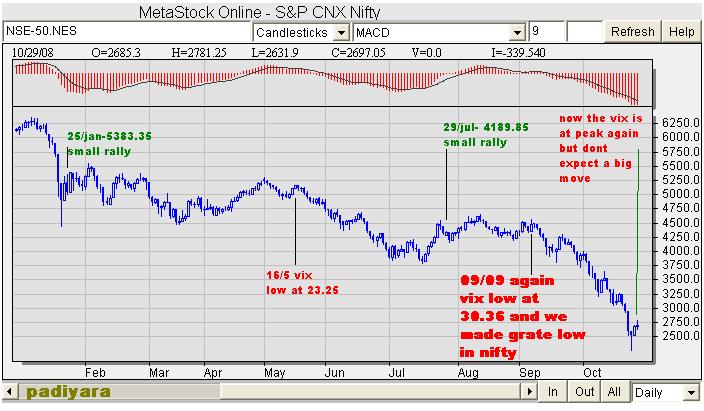
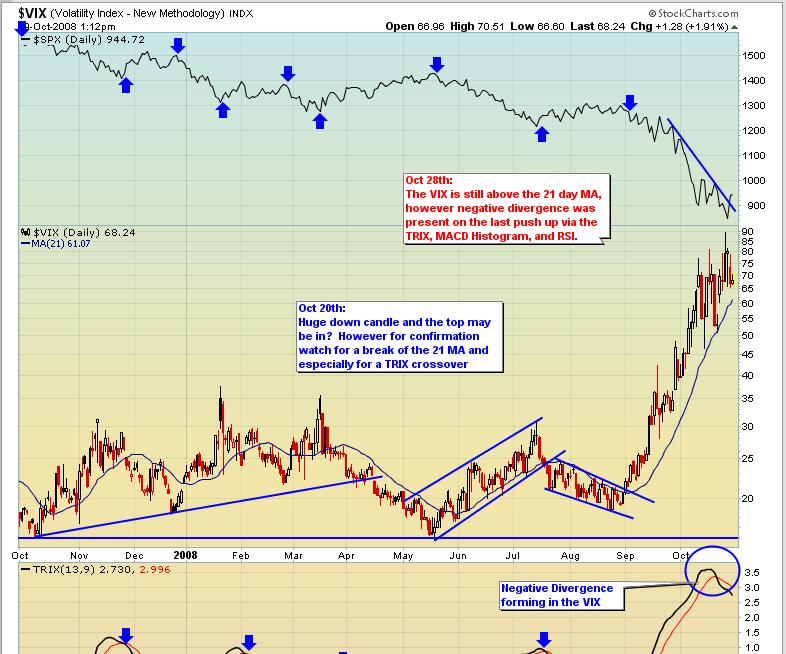
why india viks?
Tuesday, October 28, 2008
my view on sensex_target 6800
this was posted in group forums on26/10/2008.couldnt upload here due to net service problem. find ind dificultty in uploading picture here...with out a chart
the communication about stocks/ markets is very weak.
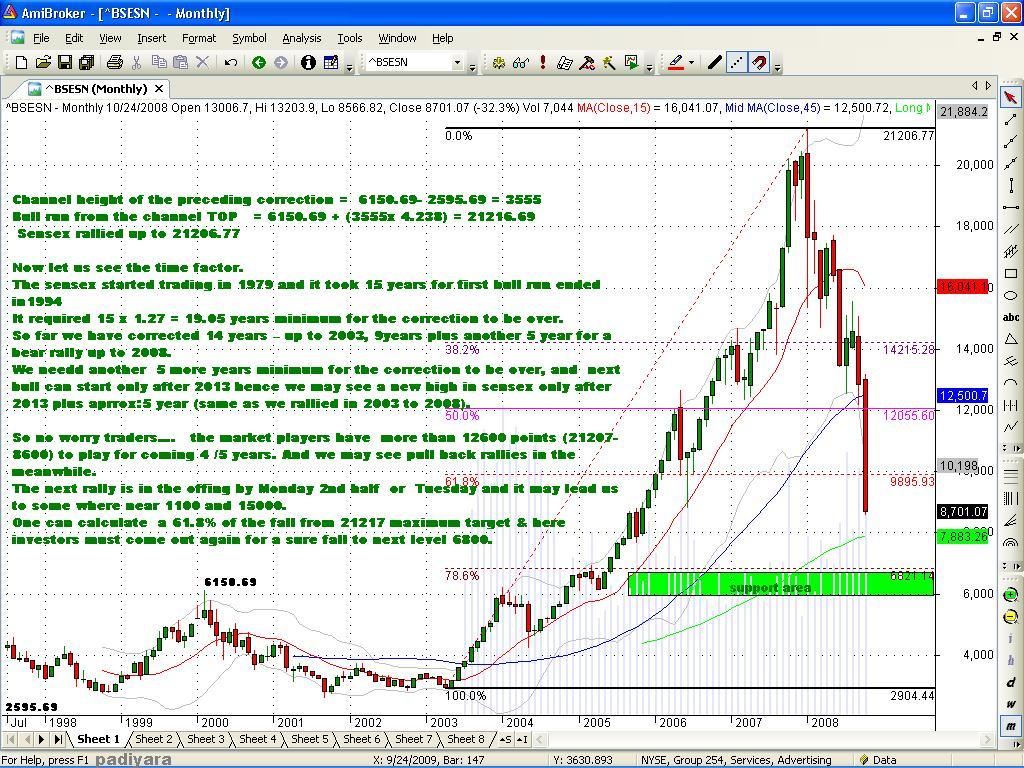
The next rally is in the offing by Monday 2nd half or Tuesday and it may lead us to some where near 11000 and then 15000.
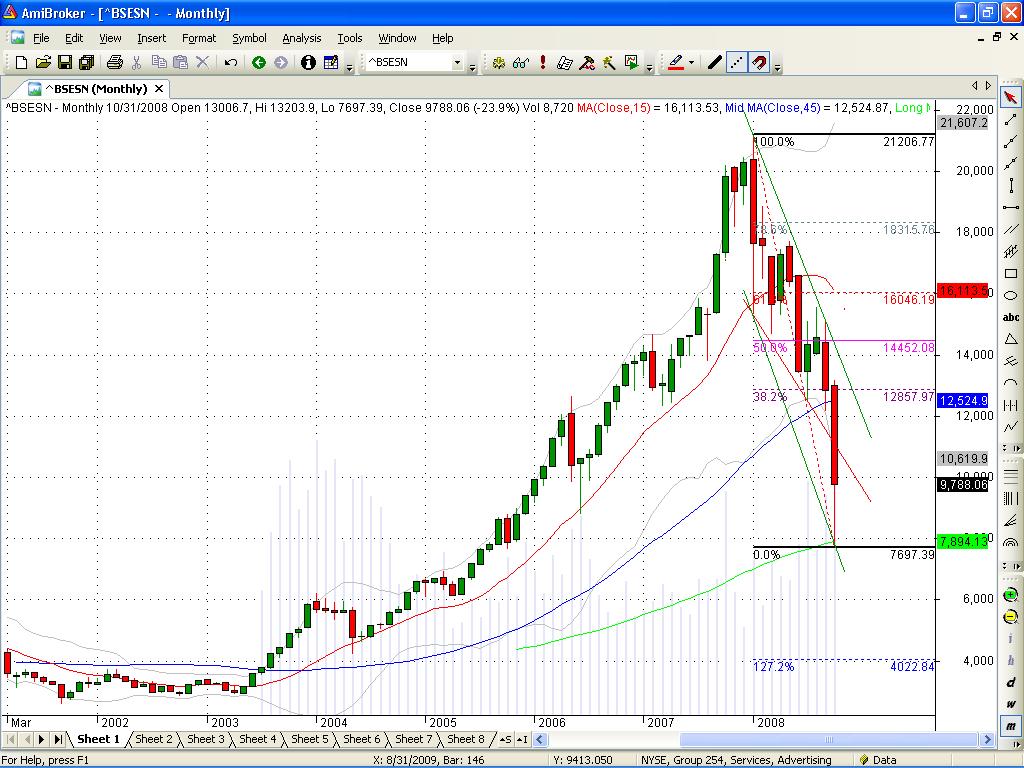
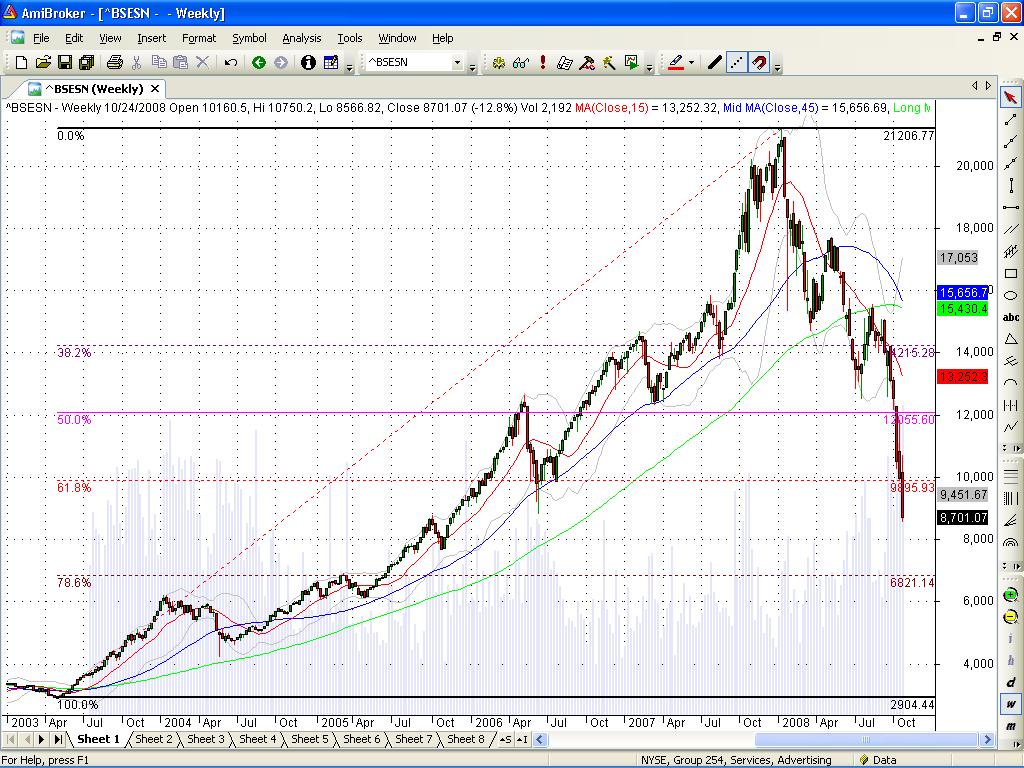
One can calculate a 61.8% of the fall from 21217 maximum target & here investors must come out again for a sure fall to next level 6800
Channel height of the preceding correction = 6150.69- 2595.69 = 3555
Bull run from the channel TOP = 6150.69 + (3555x 4.238) = 21216.69
Sensex rallied up to 21206.77
Now let us see the time factor.
The sensex started trading in 1979 and it took 15 years for first bull run ended in1994
It required 15 x 1.27 = 19.05 years minimum for the correction to be over.
So far we have corrected 14 years – up to 2003, 9years plus another 5 year for a bear rally up to 2008.
We needd another 5 more years minimum for the correction to be over, and next bull can start only after 2013 hence we may see a new high in sensex only after 2013 plus aprrox:5 year (same as we rallied in 2003 to 2008).
So no worry the traders…. the market players have more than 12600 points (21207- 8600) to play for coming 4 /5 years. And we may see pull back rallies in the meanwhile.
Thursday, October 09, 2008
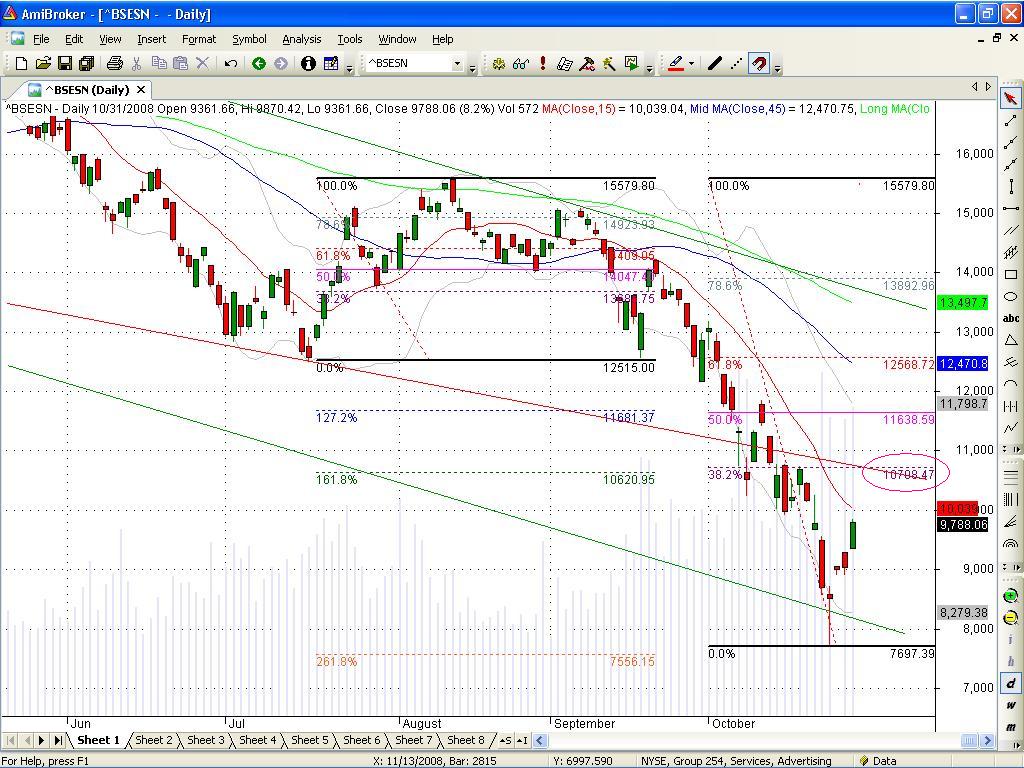
MY VIEW ON NIFTY_FOR 10 OCT
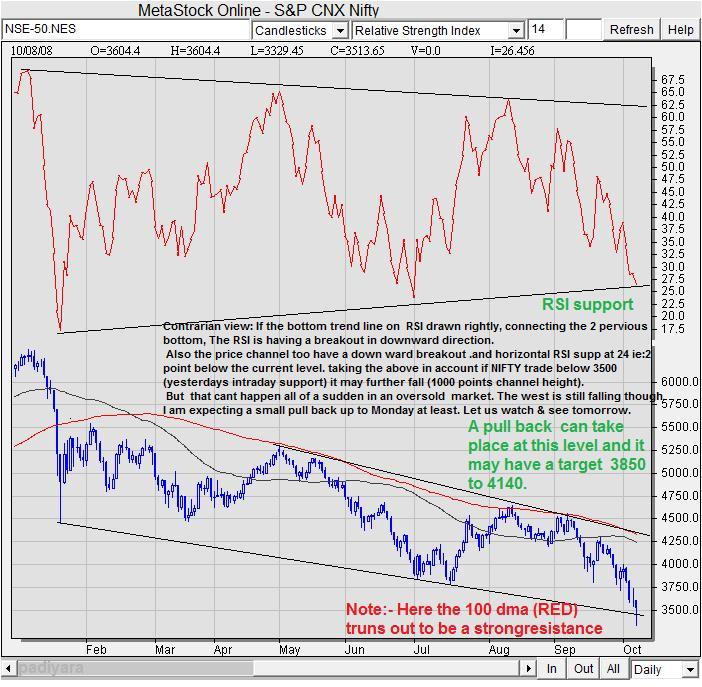
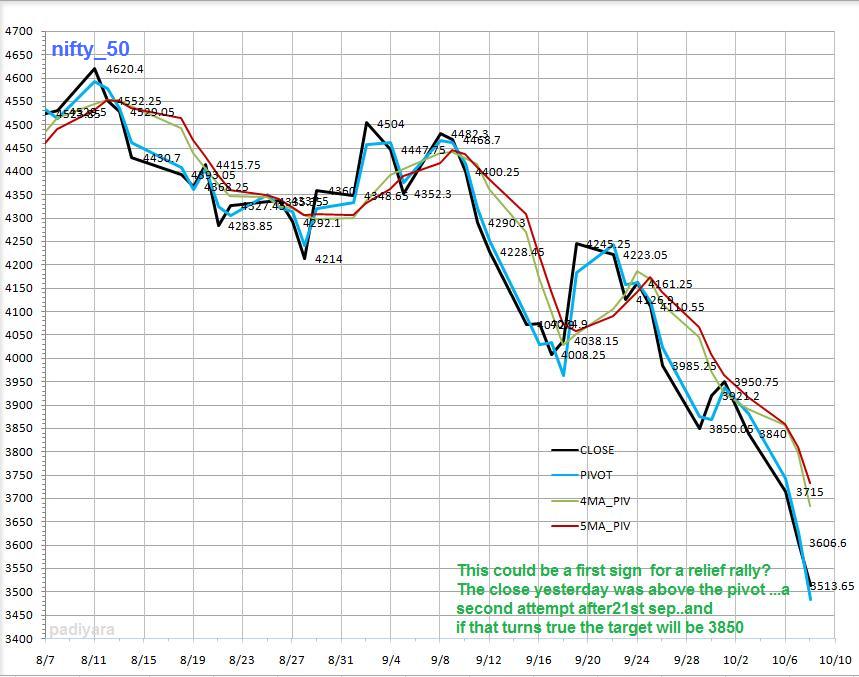
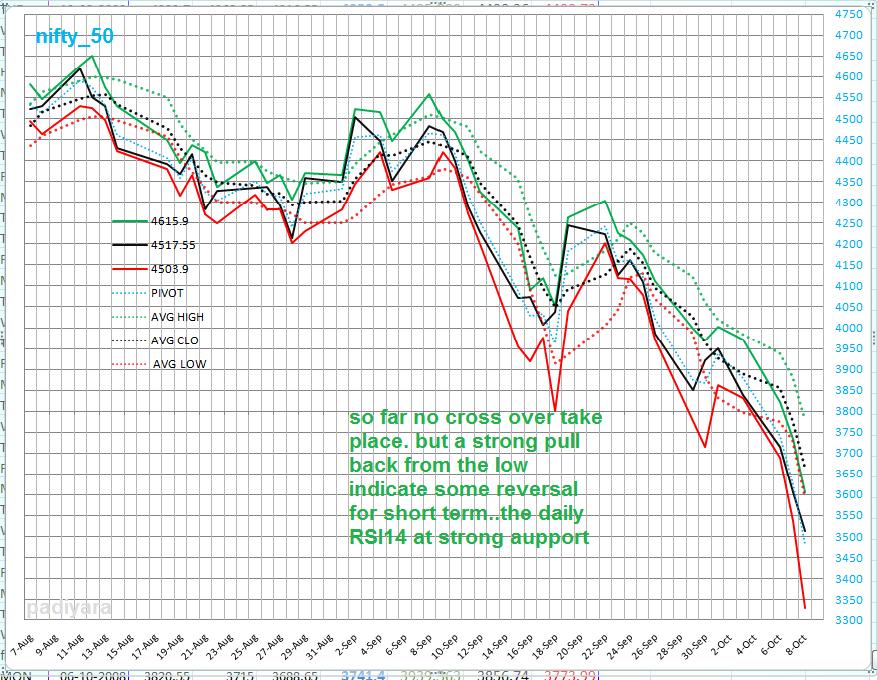
A PULL BACK CAN BE EXPECTED FROM THIS LEVEL FOR A TARGET 3850 TO 4140
Contrarian view: If the bottom trend line on RSI drawn rightly, connecting the 2 pervious bottom, The RSI is having a breakout in downward direction.
Also the price channel too have a down ward breakout .and horizontal RSI supp at 24 ie:2 point below the current level. taking the above in account if NIFTY trade below 3500 (yesterdays intraday support) it may further fall (1000 points channel height).
But that can't happen all of a sudden in an oversold market. The west is still falling though I am expecting a small pull back up to Monday at least. Let us watch & see tomorrow.
Thursday, September 25, 2008
Tuesday, September 09, 2008
Subscribe to:
Posts (Atom)
Gann Date combination for Nifty from 7511 bottom on 24.march 2020
Gann Dates falling from the bottom 7511 on 24/3/2020
-
Natco Pharma Ltd: ₹706 Can come down to 50% retracement level, having a confluence with the bottom TL. Support: ₹600. Market Ca...